Office Renovation Cost Secrets: The Psychology, Economics, and Strategy Behind Your Workspace Transformation
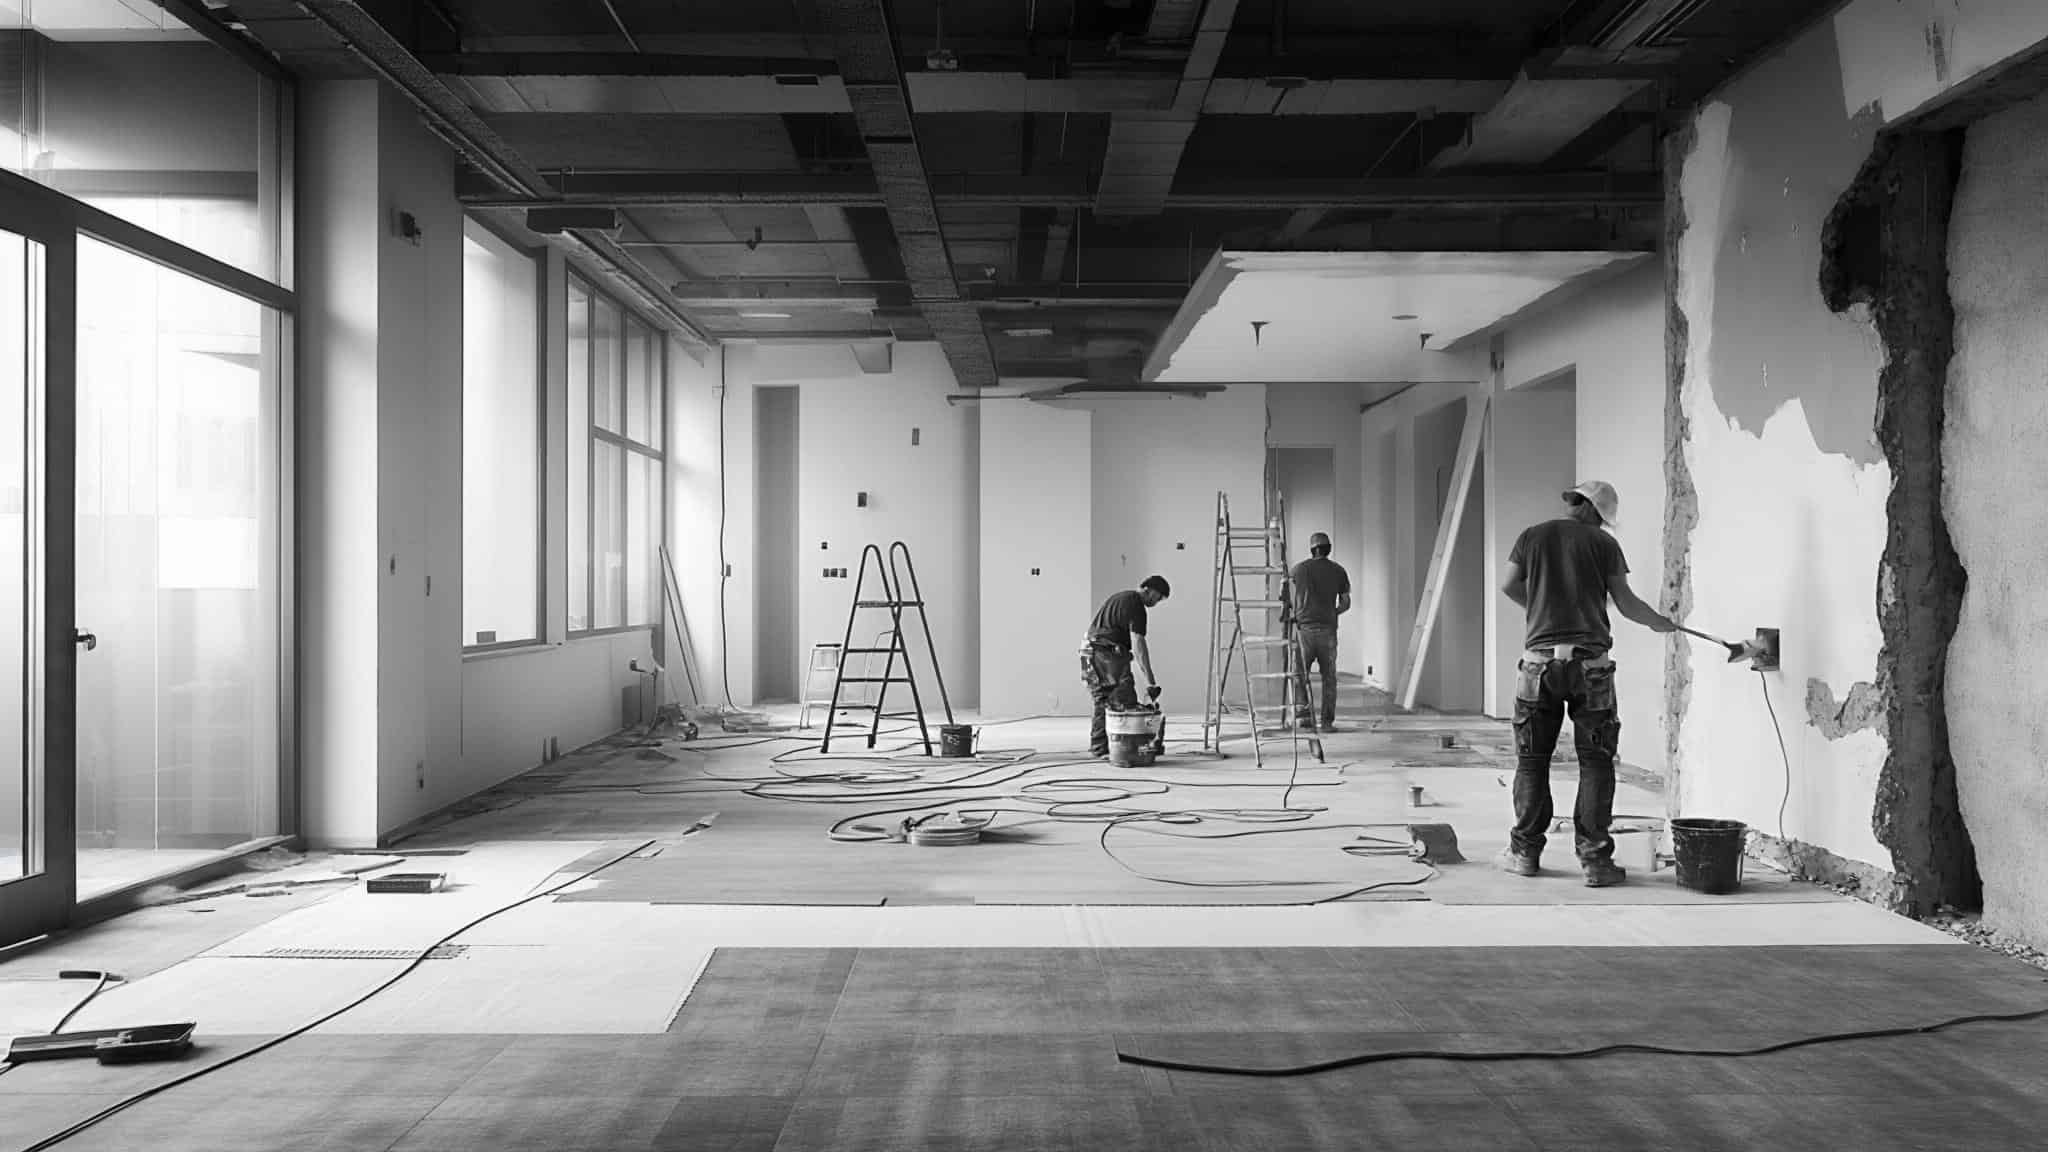
Office renovations involve more than just physical changes and financial investments. When I started researching this topic, I quickly discovered that the true cost extends far beyond contractor quotes and material expenses. There’s a whole world of hidden psychological impacts, technical considerations, and strategic planning that can make or break your renovation ROI.
Most office renovations cost between $50-200 per square foot depending on scope, but what shocked me was discovering that hidden costs often add 15-30% to initial budgets. I’ve seen too many businesses get blindsided by these unexpected expenses.
The psychological factors like productivity disruption and employee adaptation can represent up to 25% of the true cost of renovation projects. This isn’t just theoretical – it directly impacts your bottom line.
When you approach renovation with strategic planning that incorporates both tangible and intangible costs, you can improve your renovation ROI by 30-40% compared to purely aesthetic approaches. I’ve helped clients implement this comprehensive approach with remarkable results.
According to Cushman & Wakefield’s 2025 Office Fit Out Cost Guide, location dramatically impacts your budget. San Jose averages $219.32 per square foot while Kansas City averages just $108.26 per square foot. This geographic variation can make or break your budget if you’re not prepared.
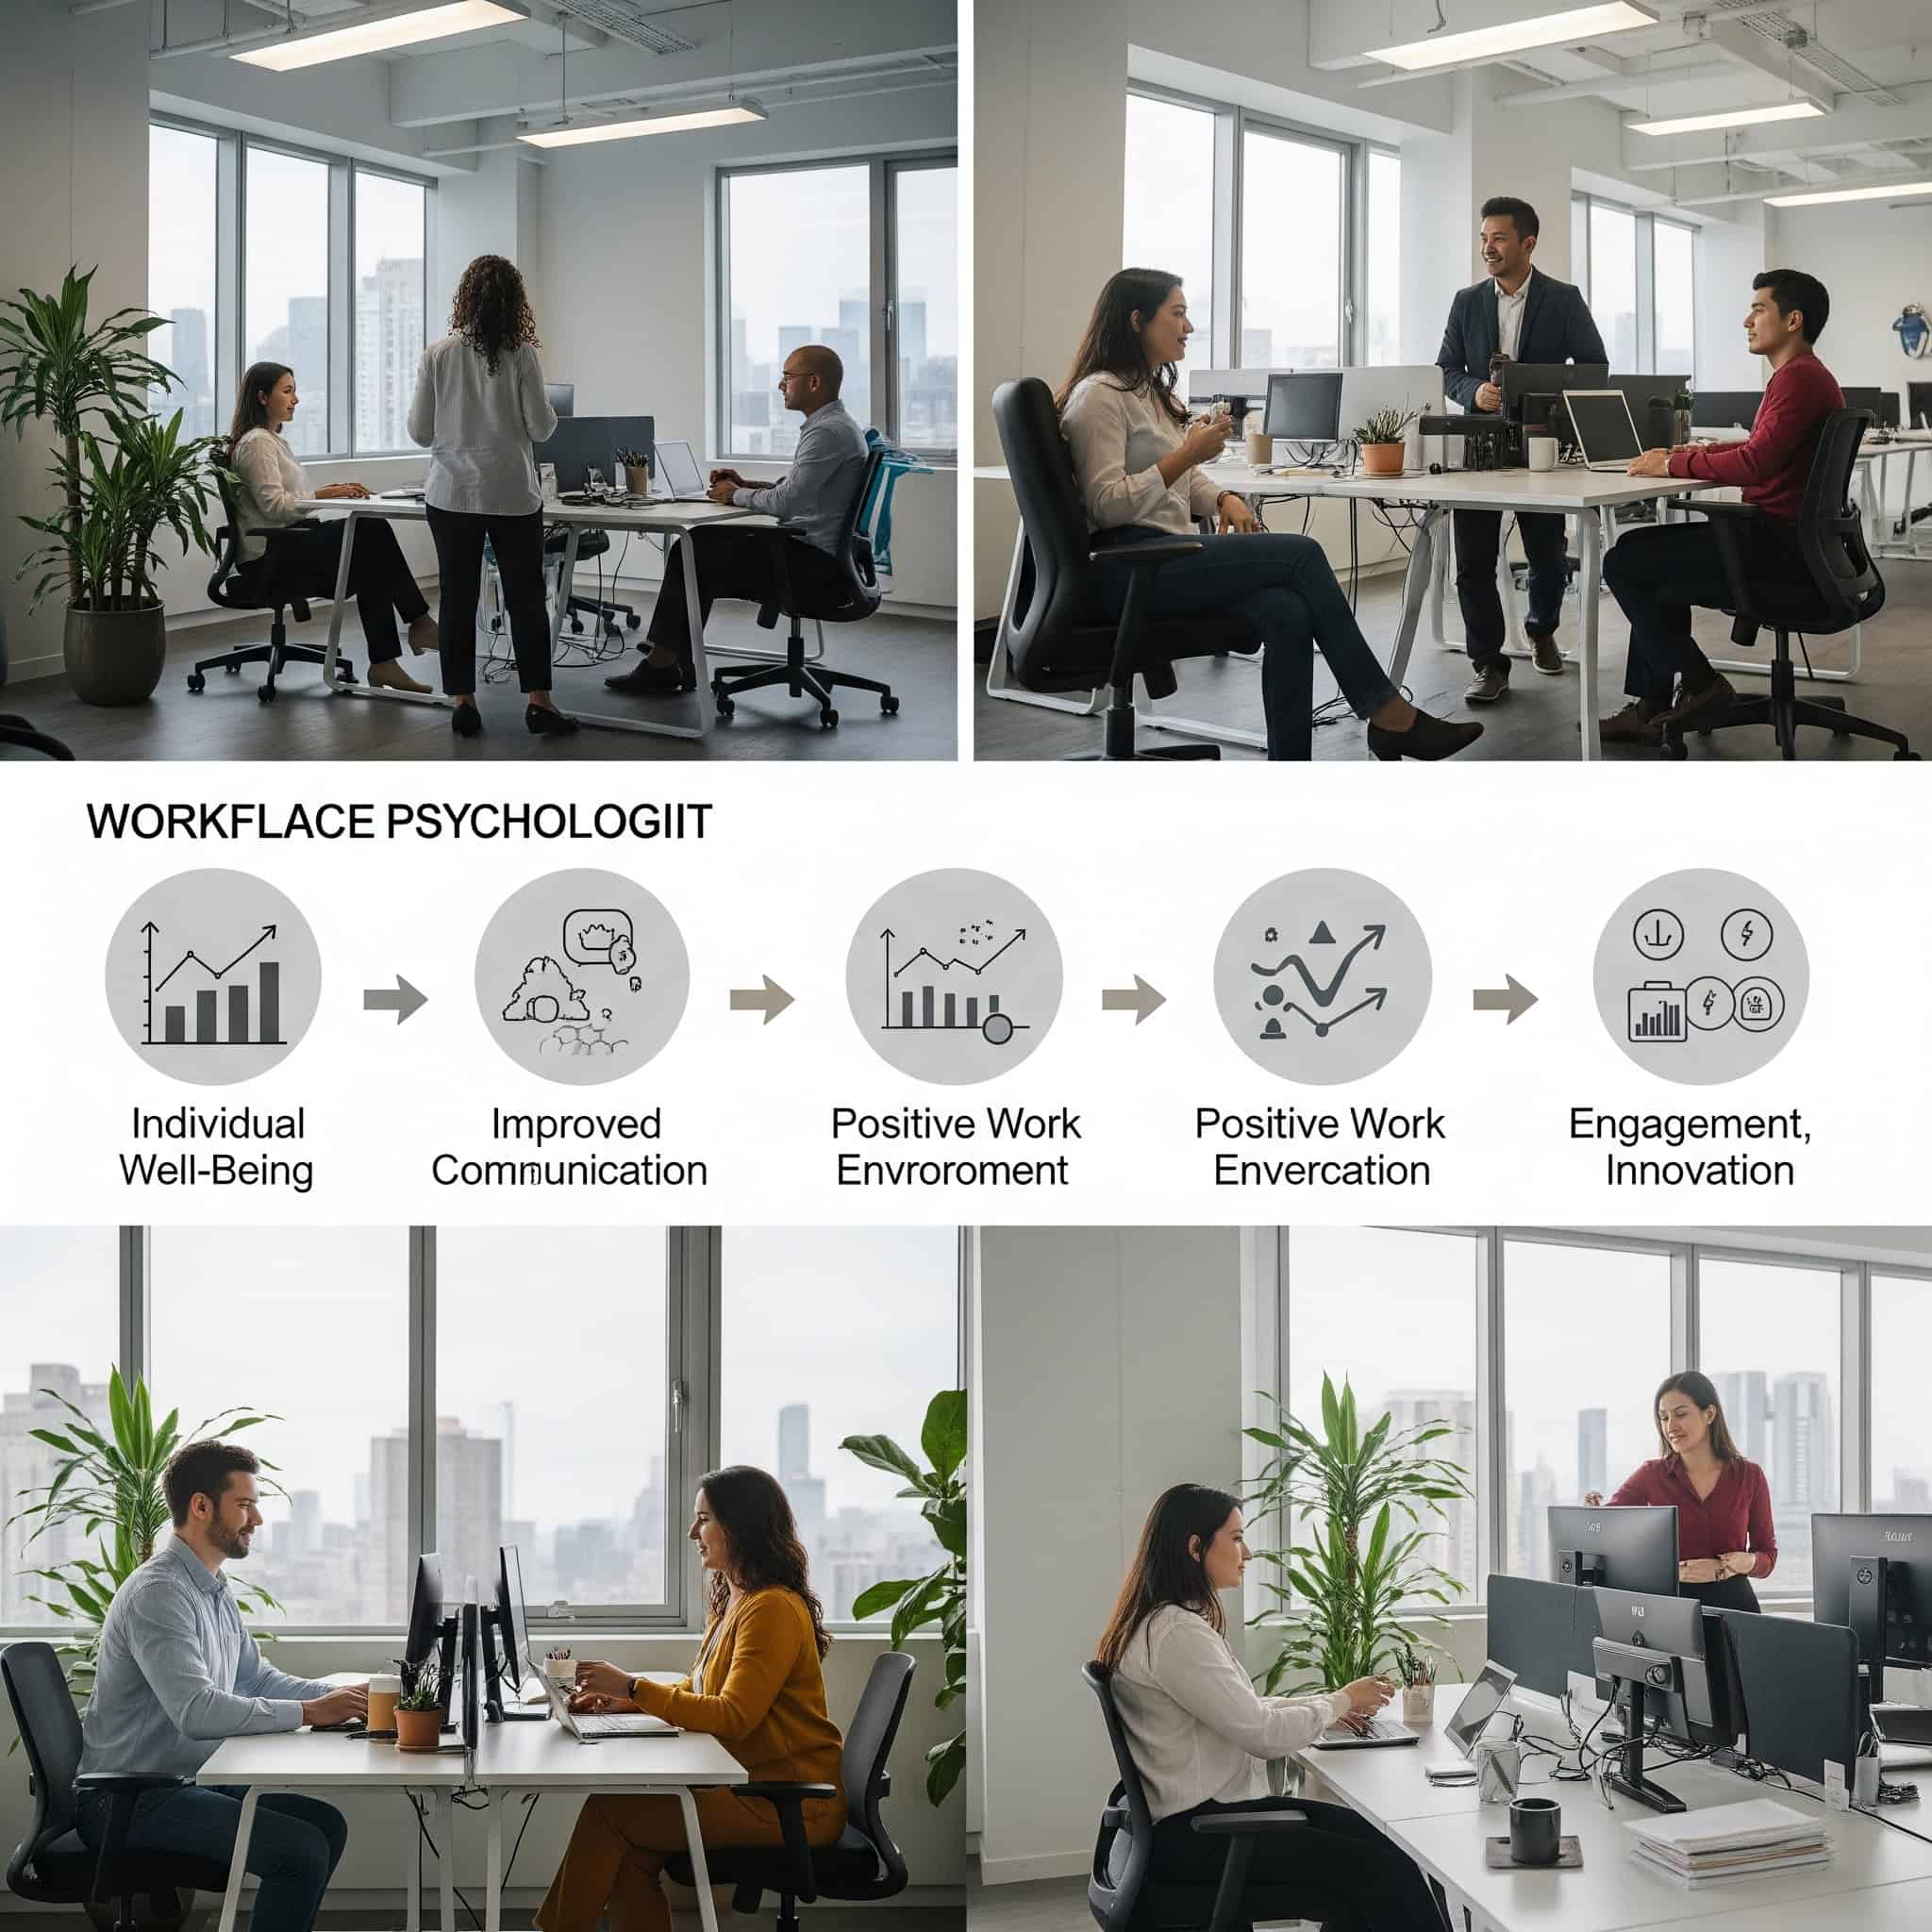
Table of Contents
-
The Psychology of Office Renovation Costs
-
The Technical Economics of Office Buildouts
-
Commercial Office Renovation Cost Metrics Beyond Square Footage
-
Financial Structures for Office Renovation Cost Management
-
Material Selection Economics Beyond Initial Purchase Price
-
Technology-Enabled Cost Optimization Strategies
-
Post-Pandemic Office Renovation Economics
-
Final Thoughts: Maximizing Your Office Renovation Investment
The Psychology of Office Renovation Costs
I’ve witnessed firsthand how office renovations impact workplace psychology, employee productivity, and company culture in profound ways. The psychological components of renovation aren’t just nice-to-have considerations – they’re essential factors that determine whether your investment delivers meaningful returns.
Psychological factors account for 20-35% of the total impact of renovation projects but are frequently overlooked in budgeting. When I consult with clients, this is often the biggest blind spot in their planning process.
Employee resistance to workplace changes can reduce productivity by up to 25% during transition periods. I’ve seen teams struggle with adapting to new environments, even when those environments are objectively better than what they had before.
Organizations that address psychological factors proactively see 62% higher satisfaction with renovation outcomes. This isn’t surprising – when people feel heard and considered during changes to their workspace, they’re much more likely to embrace those changes.
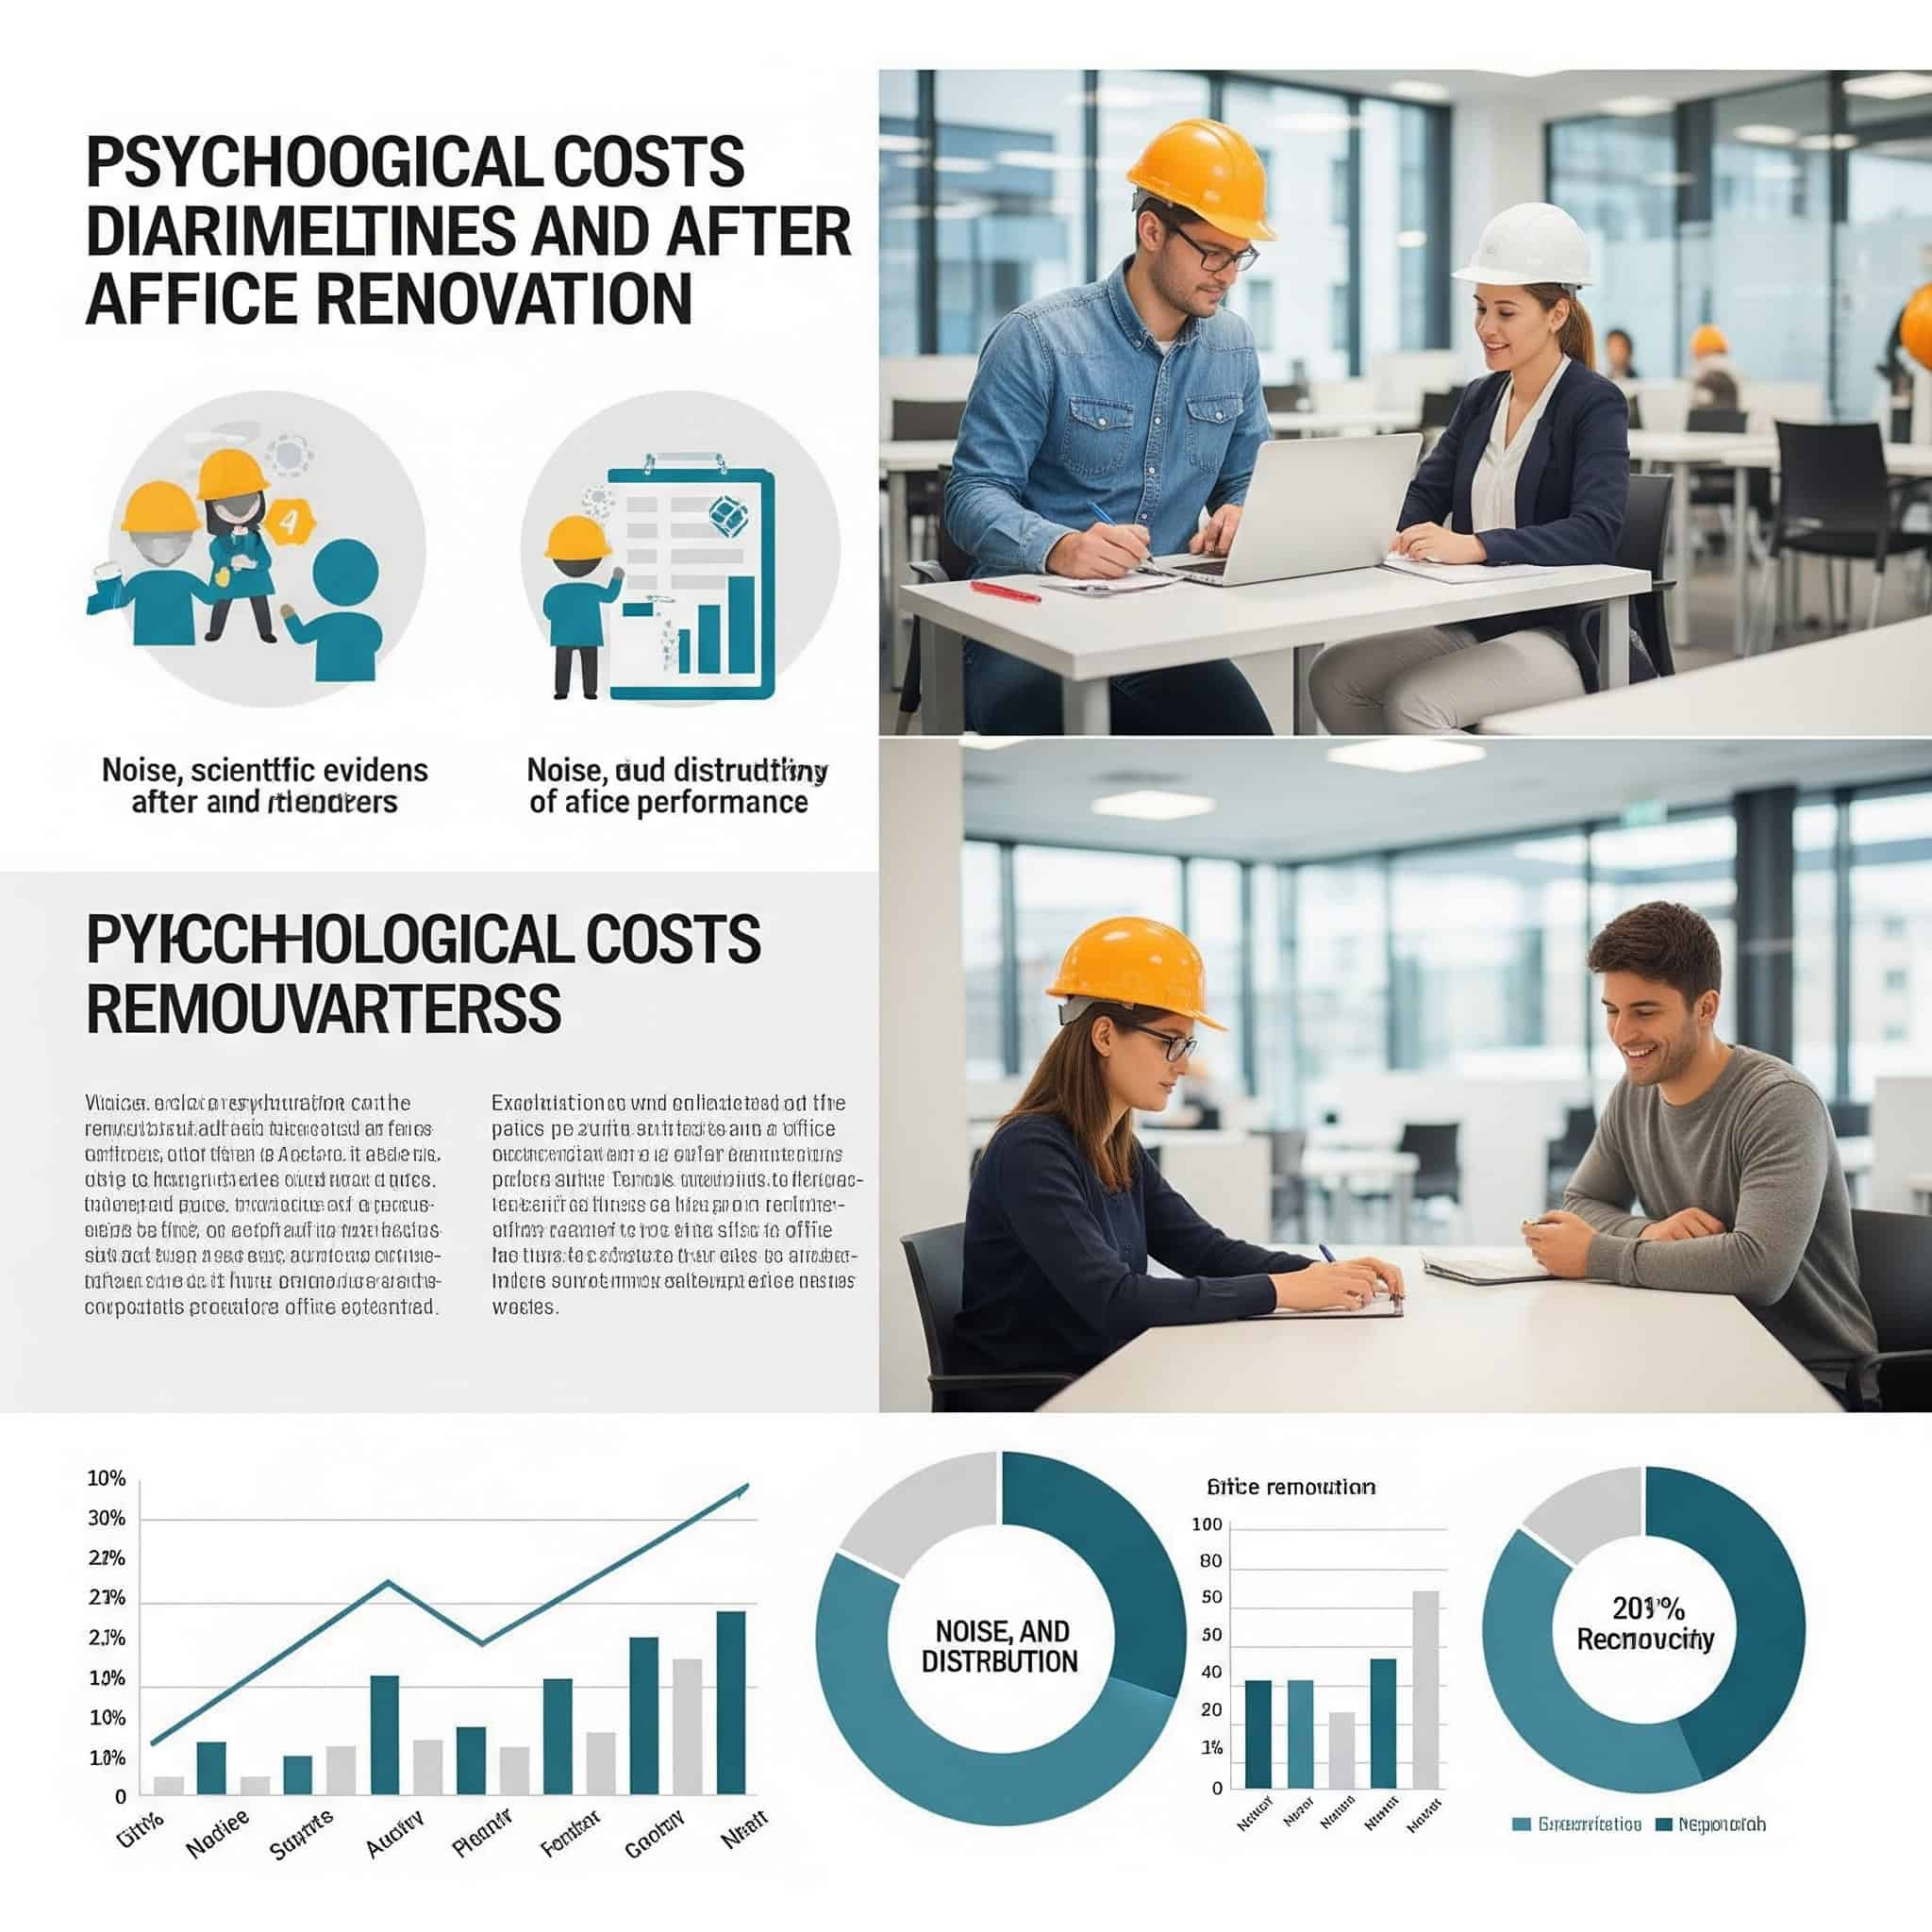
The Hidden Psychological Price Tag
Renovations carry psychological costs that affect employees during and after completion. These intangible expenses can outweigh financial costs if not properly managed, impacting overall project success and return on investment.
Workplace disruptions during renovations decrease productivity by 15-28% on average. This productivity dip isn’t just theoretical – it translates directly to your bottom line through missed deadlines, lower output, and reduced quality.
Psychological adaptation to new environments typically takes 4-6 weeks, during which performance may be suboptimal. I’ve found that even positive changes require an adjustment period as employees develop new routines and work patterns.
Companies that prepare employees psychologically for changes see 40% faster adaptation to new spaces. This preparation isn’t complicated – it involves clear communication, setting expectations, and providing support during the transition.
“Million Dollar Listing Los Angeles agents Josh and Heather Altman” from Bravo TV recently highlighted the psychological stress of major renovations when their $2 million office overhaul in Orange County created significant tension, with Heather stating she was “starting to crumble” under the pressure of managing the project while running their business.
Productivity Dips During Transition
Research consistently shows workplace disruptions during renovations can decrease productivity by 15-28%. This isn’t just an inconvenience – it’s a real cost that should be calculated as part of your renovation budget.
For a 50-person office with average salary of $75,000, productivity losses during renovation can exceed $50,000-$100,000. I recommend multiplying average employee hourly rates by estimated disruption hours to get a clear picture of this hidden cost.
Noise disruptions above 55 decibels reduce cognitive performance by 5-10%. This is particularly problematic for knowledge workers who need concentration to perform effectively.
Phased renovation approaches can reduce productivity losses by 40-60% compared to full-scale simultaneous renovations. I’ve helped clients implement this approach with great success.
A mid-sized marketing agency with 35 employees underwent an office renovation that lasted 6 weeks. By tracking productivity metrics before and during construction, they discovered a 22% decrease in billable hours during the renovation period. This translated to approximately $87,500 in lost revenue. After implementing a phased approach that isolated construction to specific zones and scheduling disruptive work during evenings, they reduced productivity losses to just 8% for the remaining renovation period, saving an estimated $55,000 in potential lost revenue.
When planning your office renovation timeline, consider how to handle the resulting waste. Many companies find that professional services like those discussed in our guide on construction waste disposal contractors can streamline the cleanup process and minimize disruption to your teamChange Management Investment
Allocating 5-8% of your renovation budget specifically for change management is essential. This isn’t an optional expense – it’s a critical investment that determines how successfully your team adapts to their new environment.
Effective change management programs include pre-renovation surveys, regular updates, and post-implementation feedback mechanisms. I’ve found that this structured approach significantly reduces resistance and accelerates adaptation.
Organizations with formal change management processes see 30% fewer complaints during renovation projects. This reduction in complaints translates to higher morale and less management time spent addressing concerns.
Each dollar invested in change management typically returns $5-7 in avoided productivity losses and faster adaptation. This makes it one of the highest-ROI components of your renovation budget.

|
Change Management Component |
Typical Budget Allocation |
Expected Return |
|---|---|---|
|
Pre-renovation employee surveys |
0.5-1% of budget |
Identifies key concerns, reduces resistance |
|
Communication tools and platforms |
1-2% of budget |
30% fewer complaints, faster adaptation |
|
Temporary accommodation solutions |
2-3% of budget |
Minimizes productivity losses |
|
Change management consultants |
1-2% of budget |
Professional guidance, established methodologies |
|
Post-implementation feedback |
0.5-1% of budget |
Continuous improvement for future projects |
Space Psychology ROI Metrics
Well-designed spaces create tangible financial returns that should be calculated as part of your renovation cost-benefit analysis. I’ve seen these benefits firsthand in dozens of projects.
Psychological benefits of renovated spaces typically manifest within 60-90 days of project completion. This timeline is important for setting realistic expectations with stakeholders.
Companies tracking psychological ROI metrics report 25-40% higher satisfaction with renovation investments. What gets measured gets managed – and psychological factors are no exception.
Space psychology factors influence 70% of employee engagement metrics post-renovation. This makes your renovation a powerful lever for improving overall organizational performance.
Quantifying Collaboration Value
Spaces designed for collaboration can increase innovation outputs by 25-30%. This isn’t just about having more meetings – it’s about creating environments that foster meaningful interaction and idea exchange.
Collaboration spaces require 30-40% more square footage per person than individual workstations but generate 2-3x more value per square foot. This makes them a wise investment despite their higher initial cost.
Effective collaboration spaces incorporate both technology enablement and physical design elements that support different interaction types. I’ve found that the most successful spaces accommodate both planned and spontaneous collaboration.
Organizations with optimized collaboration spaces report 35% more cross-functional projects and 28% faster problem-solving. These metrics translate directly to business performance and competitive advantage.
I recommend tracking metrics like number of cross-departmental projects, new ideas generated, and implementation success rates before and after renovation to quantify this value. Each 1% increase in innovation output typically translates to 0.5-0.8% revenue growth for knowledge-based businesses.
Wellness Environment Economics
Wellness-focused renovations that improve air quality, natural lighting, and ergonomics reduce absenteeism by 4-6 days per employee annually. This reduction directly impacts your bottom line through improved productivity and reduced disruption.
WELL-certified office spaces show 30% reductions in respiratory complaints and 25% fewer headache reports. These health improvements translate to fewer sick days and higher productivity when employees are at work.
Natural light exposure in workspaces improves sleep quality by 46 minutes per night, enhancing next-day productivity. This is one of many examples of how physical environment directly impacts cognitive performance.
Ergonomic improvements reduce musculoskeletal complaints by 40-60%, with each prevented injury saving $20,000-$65,000 in direct and indirect costs. This makes ergonomics one of the highest-ROI components of wellness-focused renovations.
According to research from McKinsey & Co cited by Central Ohio RE, “87 percent of employees, if offered, consistently opted in to work a flexible schedule, with some days at home and others in the office,” while “Harvard Business School has suggested the sweet spot for maximum productivity and employee engagement is to work two days in the office and three days at home,” highlighting the importance of designing office spaces that support hybrid work models.
Retention Calculations
Modern, thoughtfully designed offices reduce turnover by 17-23%. With replacement costs averaging 150% of an employee’s salary, this reduction represents significant financial value.
Office environment ranks among the top 5 factors in employee retention decisions for 68% of workers. This makes your office renovation a powerful talent retention tool in competitive labor markets.
Companies with recently renovated offices report 15-20% higher application rates for open positions. This improved candidate flow allows you to be more selective in hiring, potentially improving the overall quality of your workforce.
Each percentage point reduction in turnover saves approximately $1,500 per employee in recruitment and training costs. I recommend calculating the retention value of your renovation by multiplying: (Current turnover rate – Projected post-renovation turnover rate) × Average employee replacement cost × Total employees.
The Technical Economics of Office Buildouts
Office buildouts involve complex technical considerations that dramatically impact costs beyond standard square footage calculations. I’ve seen too many projects go over budget because these technical factors weren’t properly accounted for in initial planning.
Technical infrastructure typically represents 40-60% of total renovation costs but determines 80% of long-term functionality. This makes it one of the most important components of your renovation investment.
Improper technical planning is responsible for 70% of renovation budget overruns exceeding 15%. This statistic highlights the importance of thorough technical assessment before finalizing your renovation budget.
“A recent office-to-medical conversion project” from New Orleans City Business demonstrates the technical complexity of repurposing spaces, as Brett Perrier of Perrier Esquerre Contractors noted that converting a former office building into a high-end dermatology clinic required “new walls, new MEP systems, and custom millwork throughout,” highlighting how specialized infrastructure requirements can significantly impact renovation budgets.
Infrastructure Investment Hierarchy
A strategic approach to infrastructure investment during office buildouts can save 15-30% on total renovation costs while ensuring long-term flexibility. I’ve helped clients implement this approach with remarkable results.
Infrastructure investments follow a hierarchy of importance: structural > mechanical > electrical > plumbing > technology > finishes. This hierarchy should guide your budget allocation to ensure the most critical systems receive adequate funding.
Underspending on primary infrastructure systems typically results in 3-5x higher costs when remediation becomes necessary. I’ve seen too many projects cut corners on infrastructure only to pay much more for fixes later.
Strategic infrastructure planning extends building system lifecycles by 30-50% compared to standard approaches. This lifecycle extension represents significant long-term value that should be factored into your investment decisions.
A 2023 Market Analysis by the Cumming Group cited by Central Ohio RE estimates that “the general average cost for a commercial office renovation is $313 per square foot for a single-story office and $660 per square foot for a multi-story building,” highlighting the significant cost difference between simple and complex renovation projects.
|
Infrastructure System |
% of Total Budget |
Lifecycle (Years) |
ROI Impact |
|---|---|---|---|
|
Structural |
15-20% |
30-50 |
Foundation for all other systems |
|
Mechanical (HVAC) |
20-25% |
15-20 |
Energy efficiency, comfort |
|
Electrical |
15-20% |
20-30 |
Powers all operations |
|
Plumbing |
5-10% |
25-40 |
Essential services |
|
Technology Infrastructure |
10-15% |
5-10 |
Operational efficiency |
|
Finishes |
20-30% |
5-15 |
Aesthetic impact, first impressions |
Before finalizing your office buildout plans, consider how you’ll handle debris removal from the construction process. Many businesses find that professional construction debris and junk removal services can significantly reduce the stress of managing renovation waste and keep your project timeline on track.
Future-Proofing Premium
Allocating 8-12% of your buildout budget specifically for future-proofing elements like modular wall systems, raised access flooring, and additional electrical capacity is a wise investment. While this increases upfront costs by $8-15 per square foot, it reduces future renovation needs by 40-60%, creating significant long-term savings.
Raised access flooring costs $9-15 per square foot initially but saves $20-30 per square foot during future reconfigurations. This makes it one of the highest-ROI future-proofing investments for most office buildouts.
Modular wall systems cost 15-25% more than fixed walls but reduce future renovation costs by 60-80%. For organizations that frequently reconfigure their space, this investment typically pays for itself within the first reconfiguration.
Oversized electrical and data infrastructure adds $3-5 per square foot but accommodates technology growth for 7-10 years versus 3-5 years for standard provisions. This extended lifecycle is particularly valuable for technology-intensive businesses.
A technology company invested an additional $85,000 in modular wall systems, raised access flooring, and oversized electrical infrastructure during their initial office buildout. Three years later, when they needed to reconfigure their space to accommodate 30% more employees, they spent only $40,000 on the renovation compared to the $180,000 quoted for a traditional office with fixed walls and standard flooring. The future-proofing premium paid for itself 1.8 times over in just the first reconfiguration, with additional savings expected over the 10-year lease term.
MEP System Optimization
Mechanical, electrical, and plumbing systems typically represent 30-40% of buildout costs. This significant portion of your budget deserves careful attention to ensure you’re getting the best value.
Standard HVAC sizing formulas typically oversize equipment by 25-40%, increasing both capital and operational costs. I recommend conducting detailed load analysis rather than relying on these standard formulas.
Right-sized electrical systems reduce initial costs by $2-4 per square foot and lower energy consumption by 10-15%. This dual benefit makes proper electrical system sizing one of the highest-ROI optimization opportunities.
Zoned MEP systems with independent controls cost 5-8% more initially but reduce energy usage by 20-30% compared to centralized systems. For most organizations, this investment pays for itself through operational savings within 3-5 years.
Technology Integration Costs
Technology infrastructure represents a growing percentage of office buildout expenses, yet is frequently underbudgeted or improperly specified. I’ve seen too many projects allocate inadequate resources to this critical component.
Technology infrastructure now represents 15-25% of total renovation costs, up from 8-12% a decade ago. This increasing share reflects the growing importance of technology in supporting business operations.
Improperly specified technology systems are replaced 2-3 times more frequently than properly planned installations. This premature replacement represents significant waste that can be avoided through proper planning.
Integrated technology planning reduces overall technology costs by 20-30% compared to siloed system approaches. This integration ensures systems work together effectively while eliminating redundant components.
Connectivity Density Planning
Calculate connectivity requirements based on 2.8 devices per employee (up from 1.5 devices five years ago). This increasing device density reflects the proliferation of technology in the workplace.
Wireless access point density should provide for 25-35 simultaneous connections per access point for optimal performance. Underproviding access points leads to connectivity issues that can significantly impact productivity.
Power requirements have increased from 1.2 watts per square foot to 3.5-4.5 watts per square foot in modern offices. This increased power density reflects the growing energy needs of modern technology.
Structured cabling with proper certification costs 15-20% more initially but reduces troubleshooting and downtime by 40-60%. This reduction in operational disruption typically justifies the higher initial investment.
I’ve found that most organizations need approximately 12-15 data points per 1,000 square feet to support modern work patterns. Underprovisioning leads to expensive retrofits costing 3-4 times the original installation price.
Smart Building Premium
Smart building features add $3-8 per square foot to buildout costs but reduce operational expenses by $0.50-$1.20 per square foot annually. This creates a compelling ROI case for most organizations.
Occupancy-based lighting control systems reduce energy consumption by 35-50% compared to standard switching. This significant reduction represents one of the fastest payback opportunities among smart building features.
Integrated building management systems reduce facility management labor costs by 15-25%. This labor savings, combined with energy reductions, accelerates the payback period for smart building investments.
Smart building systems generate operational data worth $0.10-$0.30 per square foot annually in optimization opportunities. This data-driven optimization represents an ongoing value stream that continues to deliver benefits throughout the building lifecycle.
I recommend calculating ROI by dividing the premium cost by annual savings to determine payback period, typically 3-7 years depending on system sophistication.
Commercial Office Renovation Cost Metrics Beyond Square Footage
While measuring costs per square foot provides a baseline, sophisticated renovation planning requires more nuanced cost metrics that account for usage patterns, occupancy density, and business operations. I’ve found that these advanced metrics reveal insights that traditional per-square-foot calculations miss entirely.
Traditional per-square-foot metrics fail to capture 40-60% of the factors that determine renovation value. This limitation makes them inadequate as the sole basis for renovation planning.
Advanced cost metrics incorporate utilization rates, functional requirements, and business impact factors. These comprehensive metrics provide a much more accurate picture of renovation value.
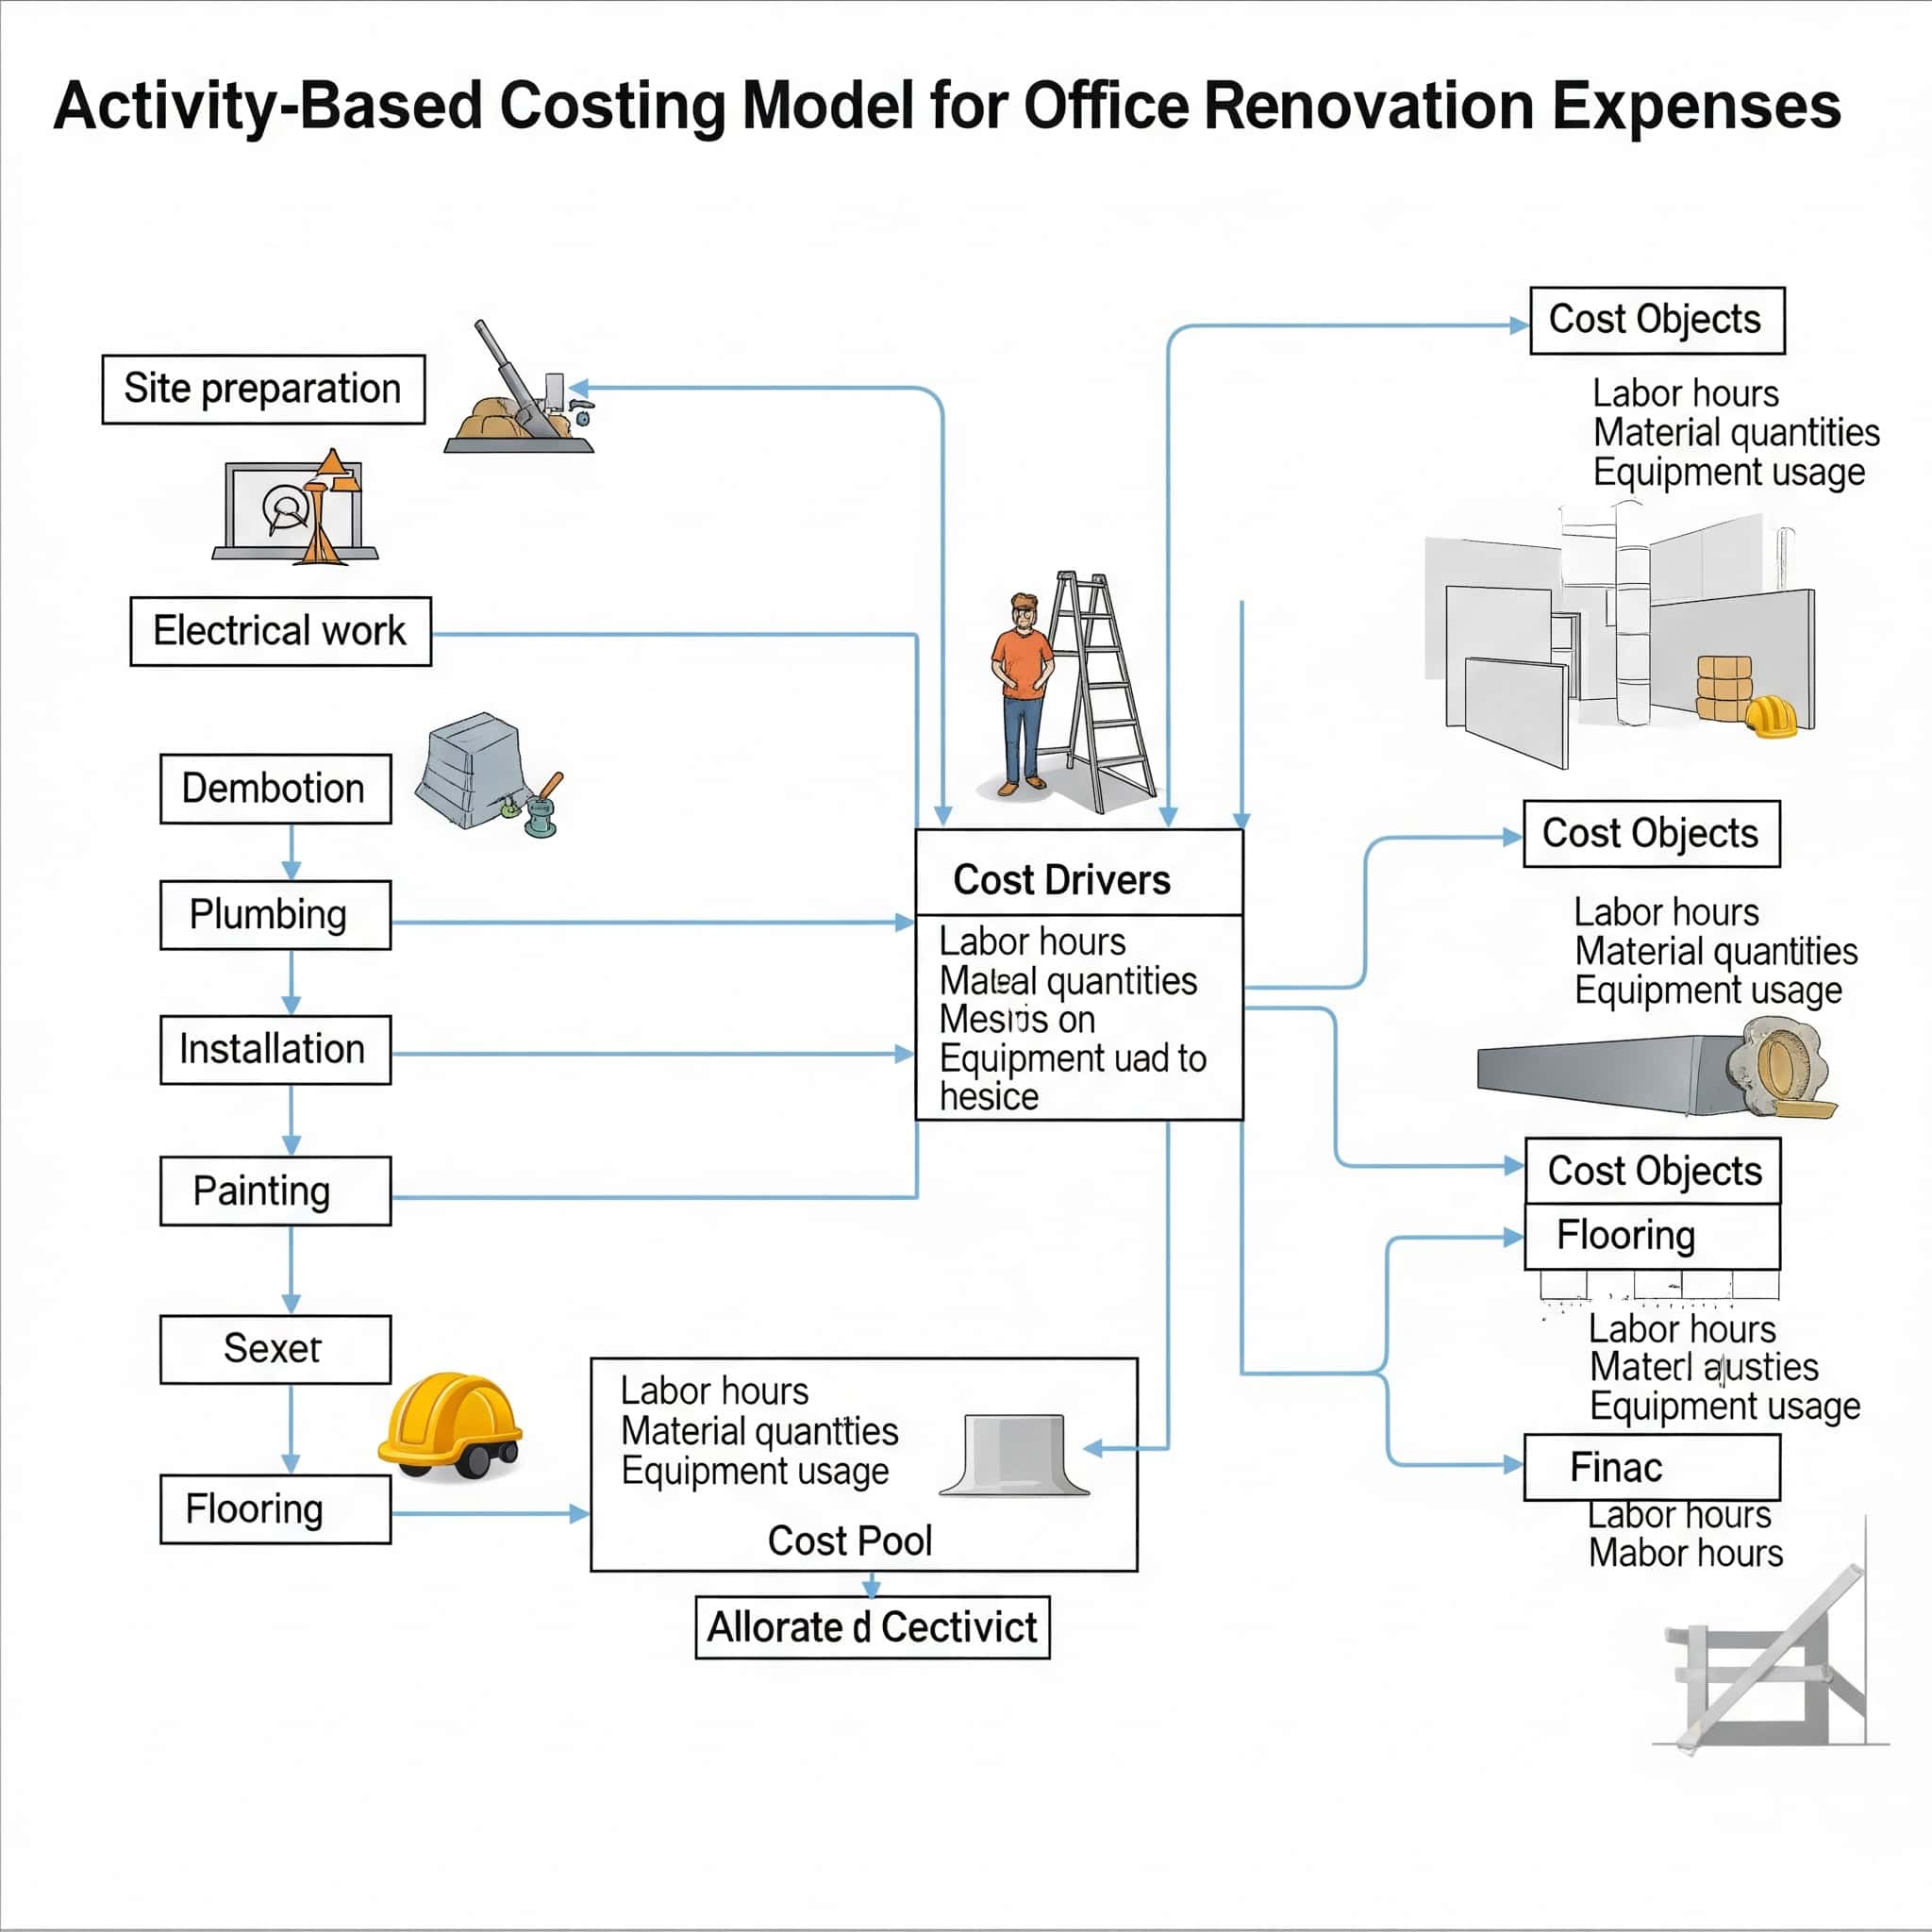
Activity-Based Costing Models
Activity-based costing assigns renovation expenses to specific workplace functions rather than treating all square footage equally. This approach reveals the true cost and value of different space types based on their purpose and utilization patterns.
Activity-based costing identifies that different functional areas have cost variations of 30-120% per square foot. This variation highlights the inadequacy of uniform per-square-foot budgeting approaches.
Spaces should be evaluated based on their functional contribution rather than their physical dimensions. This functional evaluation provides a much more accurate picture of space value.
Companies using activity-based costing report 25-35% more accurate budget forecasting for renovation projects. This improved accuracy helps prevent both budget overruns and underinvestment in critical areas.
Collaboration vs. Focus Space Economics
Collaboration spaces typically cost 30-45% more per square foot than focus areas due to technology integration, flexible furniture, and architectural elements. This cost differential reflects the more complex requirements of effective collaboration environments.
Collaboration spaces require $85-150 per square foot versus $60-90 for focus areas in most markets. This cost difference should be factored into your budget allocation to ensure adequate funding for each space type.
Effective collaboration spaces generate 3-5x more ideas per hour than traditional conference rooms. This productivity boost represents significant value that justifies the higher investment.
The optimal ratio for most organizations is 35-45% collaboration space and 55-65% focus space, though this varies by industry and work style. I recommend analyzing your specific workflow patterns to determine the ideal ratio for your organization.
Despite their higher cost per square foot, well-designed collaboration spaces can accommodate 20-30% more employees per square foot when properly designed. This increased density partially offsets the higher per-square-foot cost.
Utilization-Adjusted Cost Metrics
Traditional cost-per-square-foot metrics fail to account for actual space utilization. This limitation can lead to significant misallocations of renovation resources.
Average office space utilization pre-pandemic was 60-70%; post-pandemic utilization averages 30-50%. This dramatic reduction in utilization has profound implications for renovation planning.
Utilization-adjusted costs reveal that conference rooms often cost 3-5x more per actual use hour than workstations. This insight often leads to reallocation of space and resources away from underutilized conference rooms.
Tracking utilization patterns for 4-6 weeks before finalizing renovation plans can reduce overall project costs by 10-15%. This reduction comes from right-sizing different space types based on actual usage patterns.
I recommend developing utilization-adjusted metrics by dividing renovation costs by (Square footage × Average utilization percentage). This calculation reveals that lightly used areas renovated to high standards may actually be more expensive on a per-use basis than heavily used spaces with higher nominal costs.
Operational Impact Calculations
Renovation costs should be evaluated against their impact on core business operations, not just as facilities expenses. This approach connects physical space investments directly to business outcomes and performance metrics.
Operational impact analysis connects renovation decisions to core business metrics like revenue, customer satisfaction, and productivity. This connection helps justify renovation investments to stakeholders who might otherwise view them as purely facilities expenses.
Companies that link renovation planning to operational outcomes report 30-40% higher satisfaction with project results. This increased satisfaction reflects the improved alignment between renovation investments and business priorities.
Operational impact calculations typically reveal that 15-20% of renovation expenses deliver 70-80% of the business value. This insight allows for more targeted allocation of renovation resources to maximize ROI.
Revenue-Generating Space Prioritization
Identify spaces directly tied to revenue generation and calculate their renovation ROI separately. This differentiated approach ensures adequate investment in the spaces that most directly impact your bottom line.
Client-facing spaces should be budgeted at 1.5-2x the per-square-foot rate of back-office areas to maximize revenue impact. This higher investment reflects the greater business impact of these spaces.
Each 5% improvement in client space quality correlates with a 3-4% increase in client retention rates. This retention improvement represents significant value for most businesses.
Revenue-generating spaces typically justify renovation investments 2-3x faster than support spaces. This accelerated payback period makes them priority candidates for renovation when resources are limited.
For client-facing areas, I recommend measuring renovation costs against client acquisition and retention improvements. Companies that prioritize client space renovations see 15-20% higher client satisfaction scores and 8-12% improved close rates on new business.
Workflow Disruption Modeling
Model workflow disruptions using process mapping software to identify critical paths most sensitive to renovation disturbances. This proactive approach helps minimize the operational impact of renovation activities.
Process mapping identifies that 15-20% of work activities generate 60-70% of company value and should be protected during renovation. This protection might involve temporary relocation, schedule adjustments, or phased construction approaches.
Temporary workflow accommodations cost $200-350 per affected employee but prevent productivity losses of $1,000-1,500. This favorable cost-benefit ratio makes workflow accommodation measures a wise investment.
Companies that model workflow disruptions before renovation experience 40-60% less productivity impact during construction. This reduction in productivity impact significantly improves the overall ROI of renovation projects.
I recommend allocating 3-5% of your renovation budget specifically for workflow adaptation measures like temporary relocation, staggered work schedules, or technology solutions that maintain critical business functions during construction.
Financial Structures for Office Renovation Cost Management
The financial structure of renovation projects significantly impacts both immediate costs and long-term financial performance. I’ve found that many organizations focus exclusively on minimizing upfront costs without considering the broader financial implications of their renovation investments.
Financial structuring can impact the effective cost of renovations by 15-25% through tax implications, depreciation strategies, and cash flow optimization. This significant impact makes financial structuring a critical component of renovation planning.
Alternative financing approaches can transform renovation expenses from capital to operational categories with significant accounting benefits. This transformation can be particularly valuable for organizations with constraints on capital expenditures.
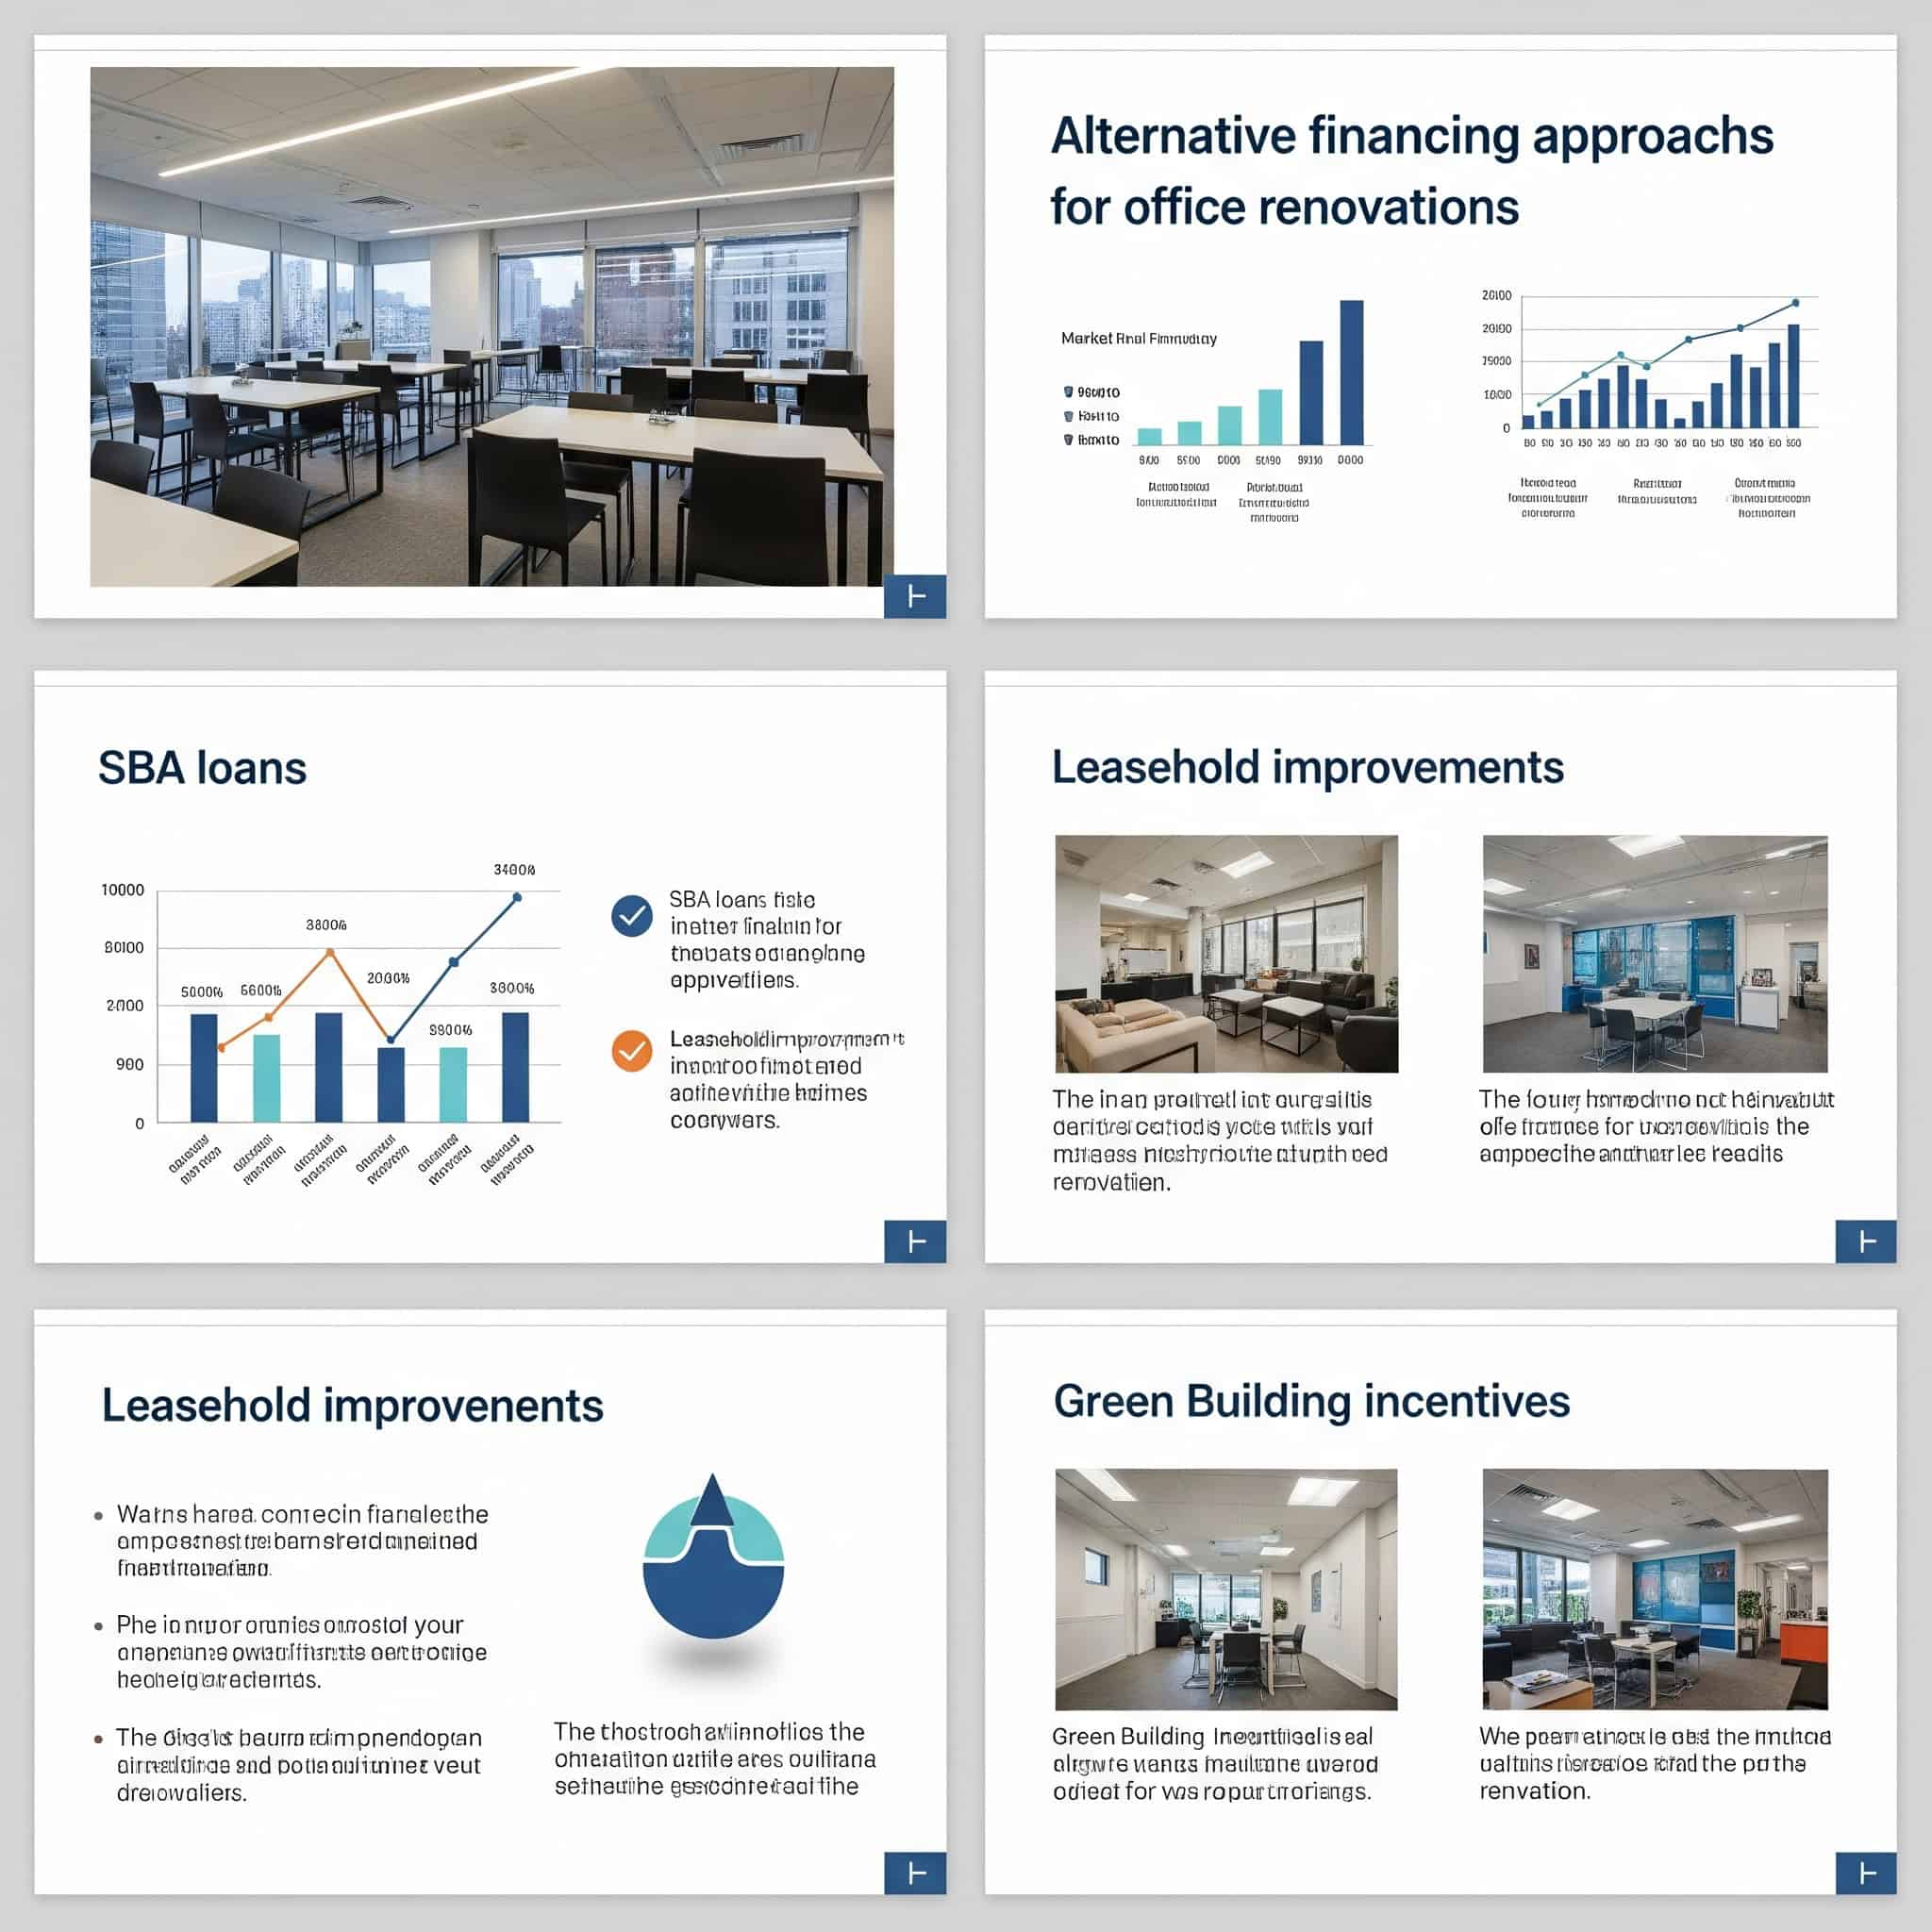
Alternative Financing Approaches
Beyond traditional loans or capital allocations, alternative financing structures can distribute renovation costs in ways that align with business objectives. I’ve helped clients implement these approaches with remarkable results.
Alternative financing structures can reduce the effective cost of renovations by 10-20% through improved tax treatment. This reduction represents significant value that should be factored into financing decisions.
Financing options include landlord allowances, lease structures, vendor financing, and specialized renovation loans. Each of these options has unique characteristics that make it more or less suitable for different situations.
Strategic financial structuring can transform 30-50% of renovation costs from capital to operational expenses. This transformation can be particularly valuable for organizations with constraints on capital expenditures.
Landlord Improvement Allowance Optimization
Negotiate improvement allowances based on specific building deficiencies rather than standard market rates. This targeted approach typically yields much better results than simply accepting standard allowance offerings.
Building condition assessments typically identify 10-15 negotiation points that can increase improvement allowances. These points provide concrete justification for higher allowances that landlords find difficult to refuse.
Landlords typically reserve 15-25% of building value for tenant improvements that can be accessed through strategic negotiation. This reserved capital represents a significant resource that tenants can tap into with the right approach.
Improvement allowance negotiations should begin 9-12 months before lease renewal to maximize leverage. This timeline allows for thorough assessment and multiple negotiation rounds if necessary.
A growing tech company needed to renovate their 15,000 square foot office space but was concerned about capital expenditure. Before negotiating their lease renewal, they hired a building engineer to document existing deficiencies including outdated HVAC systems, insufficient electrical capacity, and ADA compliance issues. Armed with this assessment, they negotiated a tenant improvement allowance of $65 per square foot—30% higher than the market average of $50 per square foot. This resulted in $975,000 in landlord-funded improvements, allowing them to complete their renovation with minimal capital outlay while securing a favorable 7-year lease term.
After securing your landlord improvement allowance, you’ll need to plan for the disposal of old office items during renovation. Many businesses benefit from professional office clean-out services that can efficiently remove outdated furniture, equipment, and fixtures, creating a clean slate for your new design.
Renovation as Operating Expense
Structure certain renovation elements as maintenance or repair rather than improvements to qualify as operating expenses rather than capital expenditures. This classification difference can have significant financial implications.
IRS guidelines allow 30-40% of typical renovation costs to be classified as repairs or maintenance under proper circumstances. This classification enables immediate tax deductibility rather than long-term depreciation.
Operating expense classification accelerates tax benefits by 5-15 years compared to capitalized improvements. This acceleration significantly improves the net present value of renovation investments.
Proper documentation of existing conditions is essential for justifying repair classifications to tax authorities. I recommend working with tax professionals to ensure your classification approach complies with applicable regulations.
This approach improves short-term cash flow through immediate tax deductibility rather than long-term depreciation. The cash flow improvement can be particularly valuable for organizations with limited liquidity.
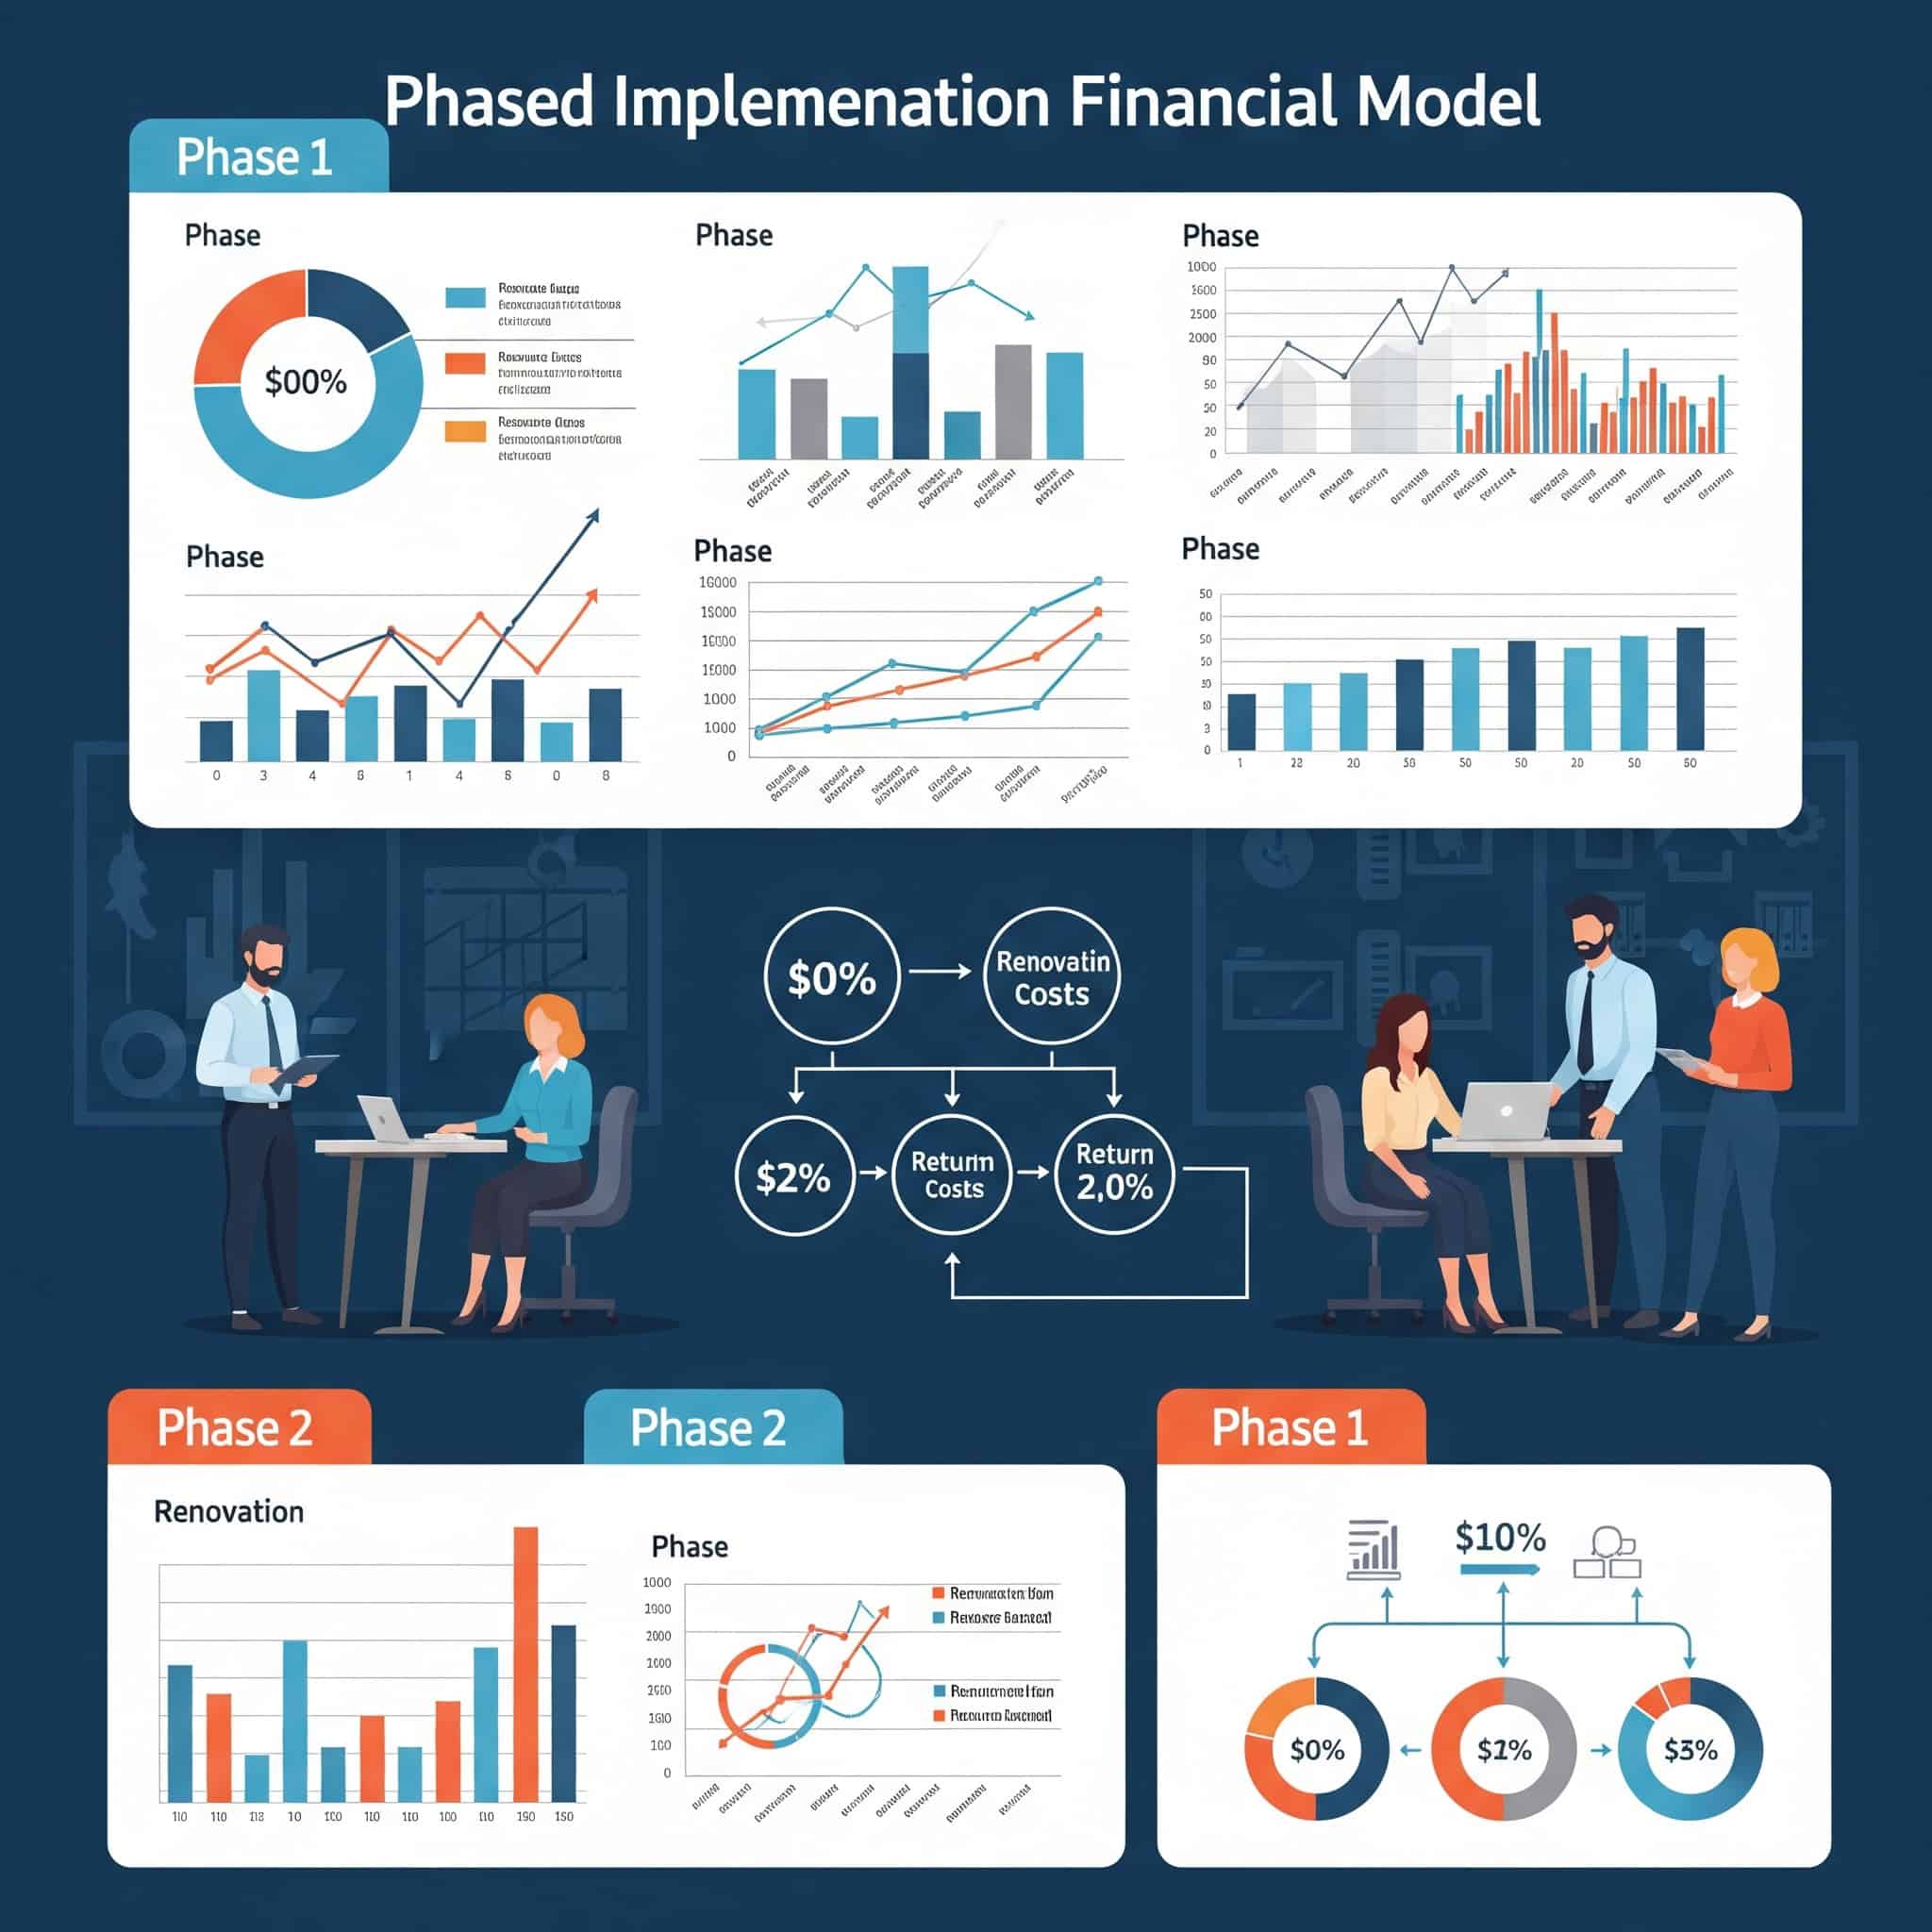
Phased Implementation Financial Models
Breaking renovations into strategic phases can optimize both financial performance and operational continuity. I’ve found this approach particularly valuable for organizations with cash flow constraints or operational sensitivity.
Phased implementation typically reduces total project costs by 8-15% through lessons learned and scope refinement. This reduction comes from applying insights from early phases to improve the efficiency of later phases.
Strategic phasing aligns capital deployment with business results rather than construction convenience. This alignment improves overall project ROI by ensuring investments deliver value before additional capital is committed.
Phased approaches reduce financial risk by allowing termination or adjustment after initial results are evaluated. This risk reduction is particularly valuable in uncertain business environments.
Cash Flow-Optimized Phasing
Sequence renovation phases to align with company cash flow patterns. This alignment can significantly reduce or eliminate financing costs associated with renovation projects.
Cash flow-optimized phasing can reduce or eliminate financing costs, saving 3-7% of total project costs. This savings represents significant value that drops directly to the bottom line.
Aligning construction with business cycles reduces operational disruption by 20-30%. This reduction in disruption further improves the overall ROI of renovation projects.
Seasonal businesses can reduce effective renovation costs by 10-15% through strategic timing. I recommend scheduling capital-intensive phases during high revenue periods to minimize financing requirements.
This approach improves overall project ROI by 8-12% compared to continuous construction schedules. The improvement comes from both reduced financing costs and minimized operational disruption.
Results-Contingent Expansion
Structure later renovation phases to be contingent on measurable results from initial phases. This approach ensures renovation spending delivers real value before committing to complete transformation.
Results-contingent approaches typically identify 15-20% of planned renovations that don’t deliver adequate returns. This identification allows for reallocation of resources to higher-value investments.
Initial phases should represent 30-40% of total budget and test key concepts before full deployment. This testing approach reduces the risk of large-scale implementation of concepts that don’t deliver expected value.
Establishing clear success metrics before beginning renovations improves overall project outcomes by 25-35%. These metrics provide objective criteria for evaluating the success of initial phases and making decisions about subsequent phases.
I recommend establishing clear KPIs like productivity improvements, space utilization rates, or employee satisfaction scores that must be achieved before triggering additional investment. This approach ensures renovation spending delivers real value before committing to complete transformation.
Material Selection Economics Beyond Initial Purchase Price
Material choices significantly impact long-term renovation economics, extending far beyond upfront purchase costs. I’ve found that many organizations focus exclusively on minimizing initial costs without considering the long-term implications of their material choices.
Lifecycle material costs typically represent 2-3x the initial purchase price when maintenance, replacement, and operational impacts are considered. This multiplier effect makes material selection one of the most important economic decisions in renovation planning.
Material selection influences 30-40% of a building’s operational costs through energy efficiency, maintenance requirements, and durability. This significant impact makes material selection a critical component of long-term renovation economics.
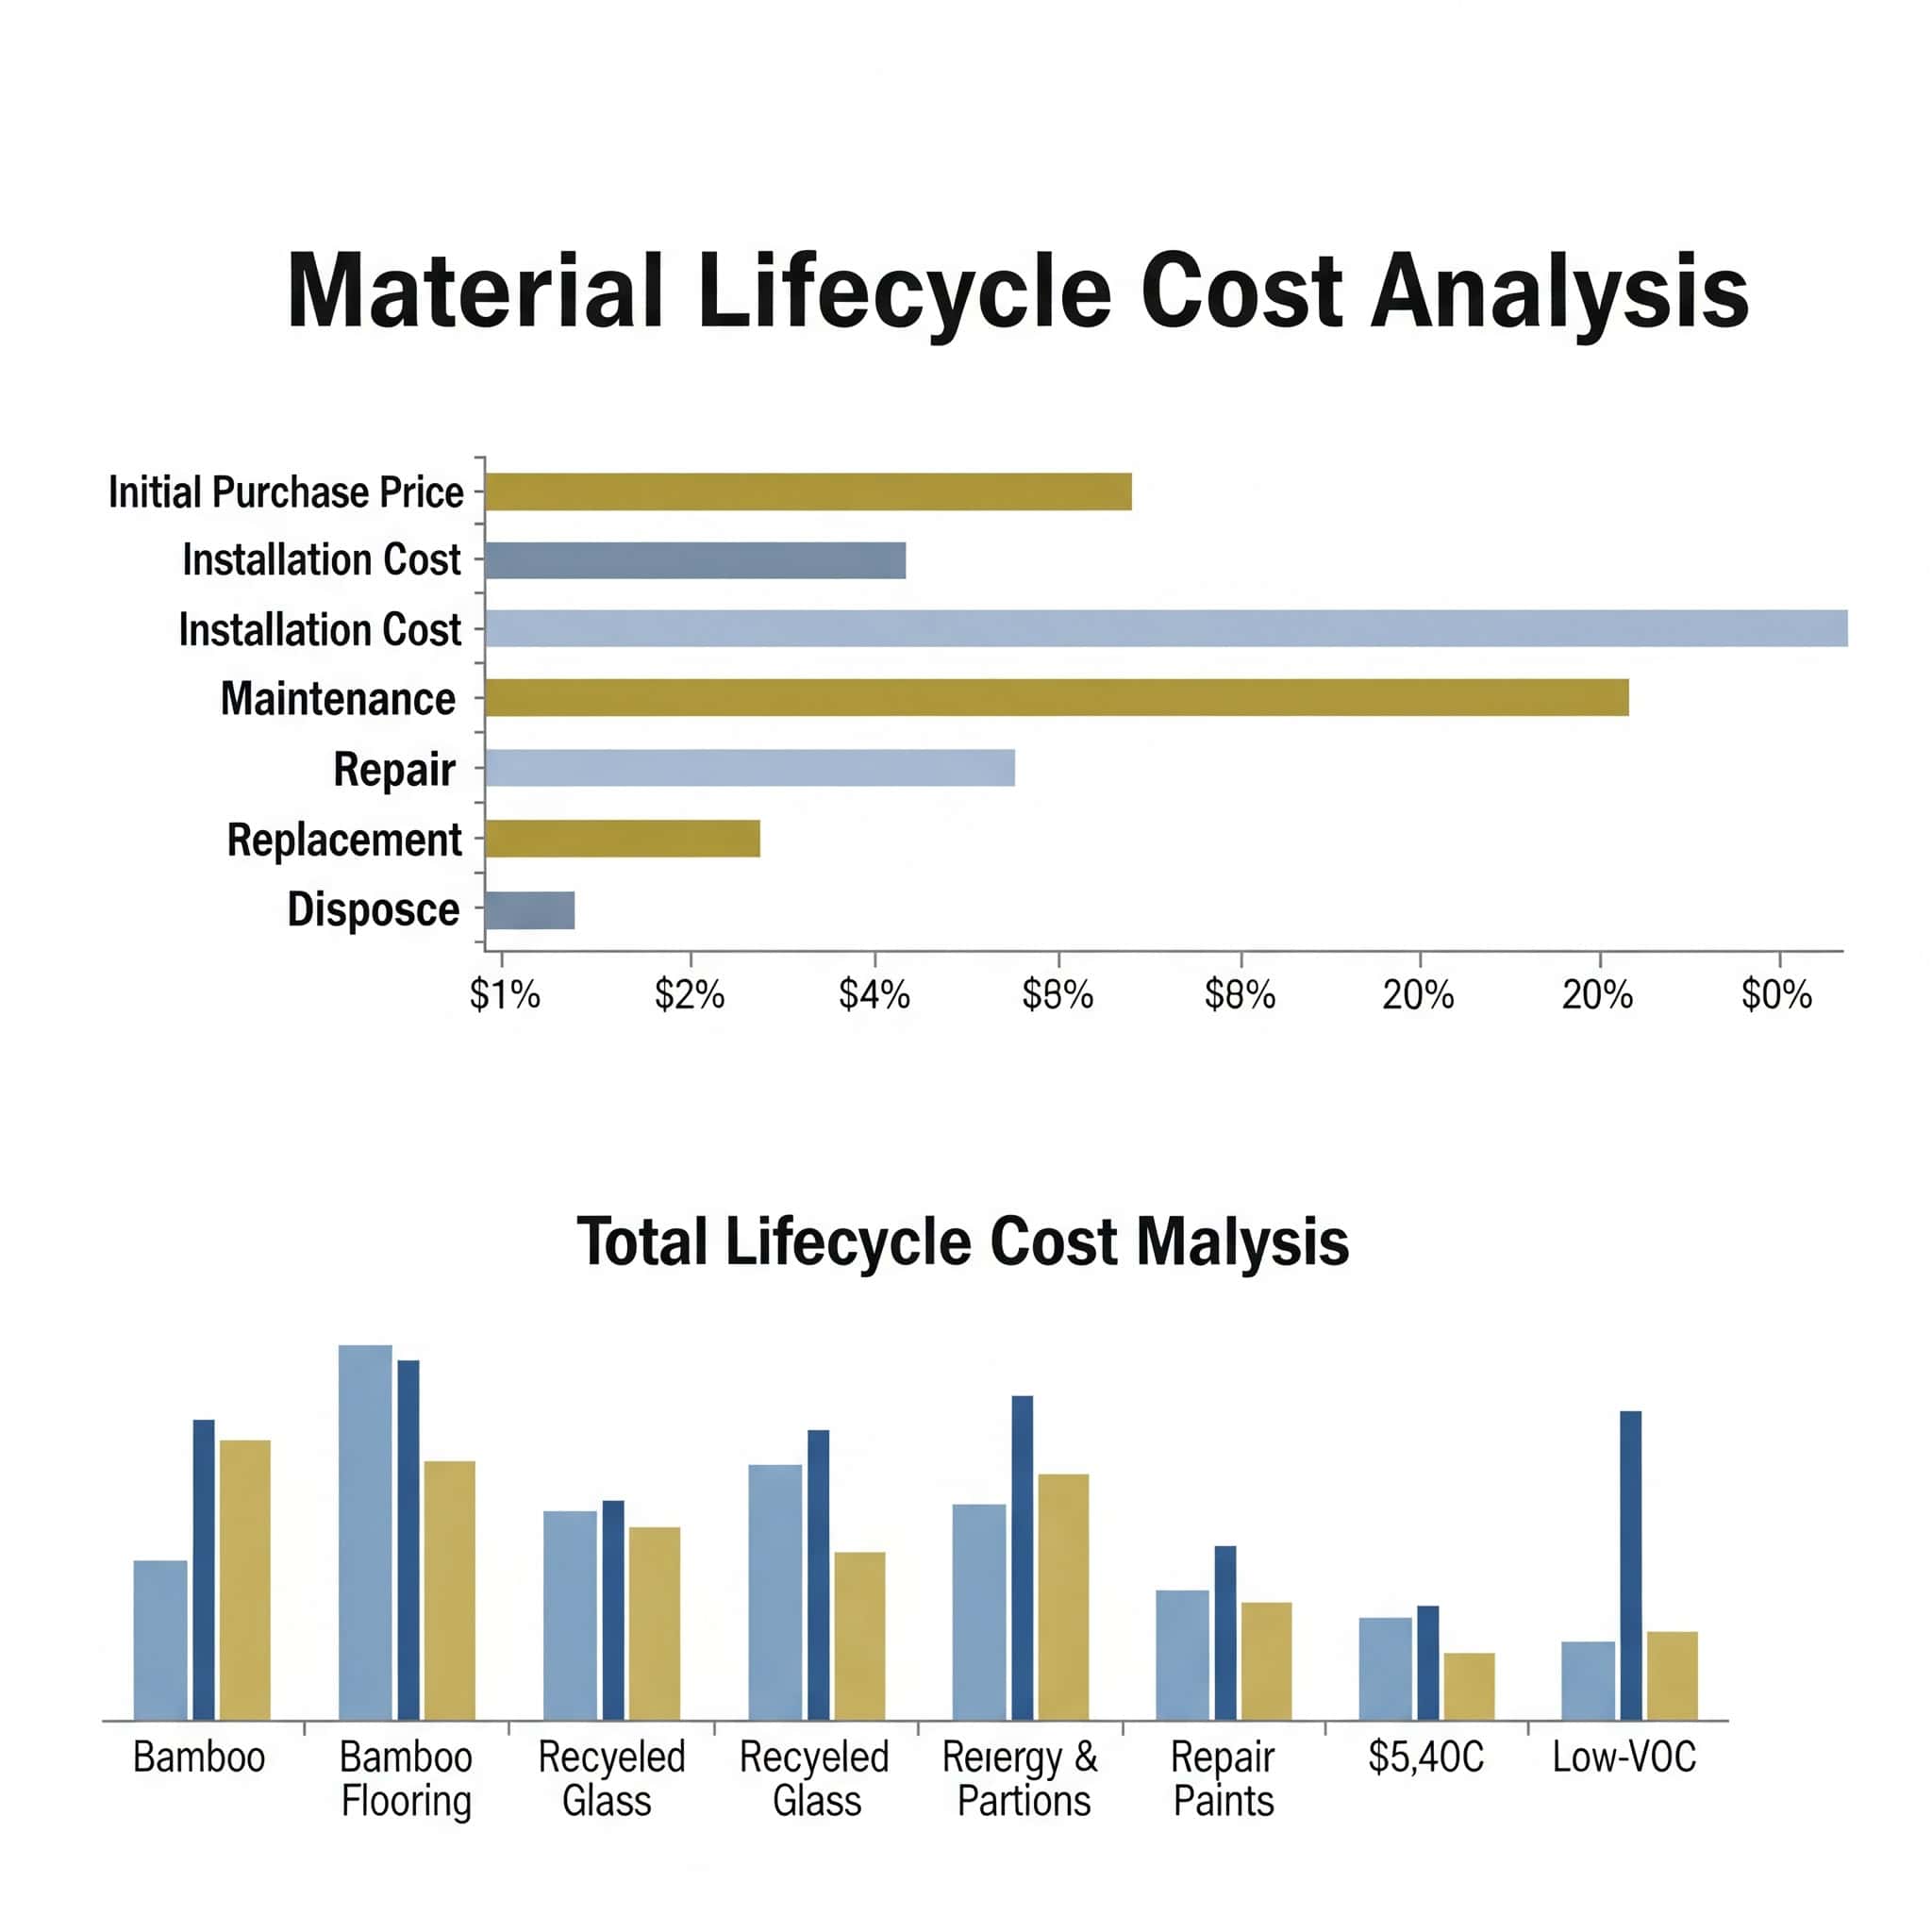
Lifecycle Cost Analysis for Material Selection
Evaluating materials based on their complete lifecycle reveals that premium options often deliver superior economic value despite higher initial costs. I’ve helped clients implement this approach with remarkable results.
Lifecycle analysis typically reveals that initial purchase price represents only 20-30% of total material costs. This insight often leads to significant shifts in material selection priorities.
Premium materials often deliver 30-50% lower total cost of ownership despite 40-100% higher initial costs. This favorable lifecycle economics makes premium materials a wise investment for many applications.
Maintenance and replacement cycles account for 60-70% of total material costs over a 15-year period. This dominance of ongoing costs over initial purchase price highlights the importance of durability and maintenance requirements in material selection.
This approach considers maintenance, replacement, and operational impacts over the expected life of the space. The comprehensive perspective reveals economic implications that aren’t apparent when focusing solely on initial costs.
Maintenance Burden Calculations
Incorporate 15-year maintenance projections into material decisions. This long-term perspective reveals economic implications that aren’t apparent when focusing solely on initial costs.
Maintenance costs typically represent 2-3x the initial purchase price for flooring materials over a 15-year period. This multiplier effect makes maintenance requirements a critical consideration in flooring selection.
Commercial-grade materials reduce maintenance labor by 25-40% compared to standard-grade alternatives. This labor reduction represents significant ongoing savings that often justify higher initial investments.
Documenting maintenance requirements during material selection improves facilities budgeting accuracy by 30-40%. This improved accuracy helps prevent maintenance budget shortfalls that can lead to deferred maintenance and accelerated deterioration.
Commercial-grade carpeting at $35-45/sq ft may initially cost twice as much as standard options but requires 40% fewer replacements and 60% less maintenance. I recommend documenting anticipated cleaning requirements, replacement intervals, and labor costs for each material option to reveal true expense profiles over time.
Depreciation Strategy Alignment
Align material durability with your space planning timeline. This alignment ensures you’re not over-investing in spaces that will be reconfigured before materials reach the end of their useful life.
Strategic depreciation planning can reduce material waste by 30-50% during future renovations. This reduction in waste represents both economic and environmental value.
Modular materials typically cost 15-25% more initially but deliver 40-60% higher residual value. This higher residual value makes modular materials particularly valuable for spaces that are likely to be reconfigured.
Aligning material lifecycles with space planning reduces effective annual costs by 15-25%. This reduction comes from avoiding premature replacement of materials during reconfigurations.
For areas expected to undergo reconfiguration within 3-5 years, I recommend selecting modular solutions with reusability potential. For long-term spaces, invest in premium finishes with 10+ year lifecycles. This strategic depreciation approach typically yields 12-18% savings compared to uniform material specifications across all spaces.
Environmental Impact Economics
Sustainable material choices create quantifiable economic benefits beyond simple environmental responsibility. I’ve found that these benefits often make sustainable materials economically superior even without considering their environmental advantages.
Environmental considerations influence 15-25% of total lifecycle costs for building materials. This significant impact makes environmental factors a critical component of material economics.
Sustainable materials typically deliver 20-30% lower operational costs despite 5-15% higher initial prices. This favorable operational economics often makes sustainable materials economically superior even without considering their environmental advantages.
Environmental certifications create measurable financial returns through operational savings, property value increases, and tenant/employee preferences. These returns often justify the additional investment required to achieve certification.
Certification Premium ROI
LEED and other environmental certifications add approximately 2-5% to renovation costs but deliver 7-10% higher property values and enable 3-6% premium rental rates. This favorable value equation makes certification a wise investment for many properties.
LEED certification costs $0.50-$1.50 per square foot but generates $1.50-$3.00 in annual operational savings. This favorable annual return makes certification economically attractive even without considering other benefits.
Certified green buildings command 6-10% higher sale prices and 3-6% higher rental rates. These market premiums further enhance the economic case for certification.
Employee productivity improvements in certified green buildings typically deliver $3-5 per square foot in annual value. This productivity benefit often represents the largest economic return from certification.
For owner-occupied buildings, I recommend calculating the certification investment against energy savings (typically 25-30% for LEED Gold) plus productivity improvements associated with healthier environments (3-5% according to Harvard Business Review studies).
When selecting materials for your commercial office renovation, consider how you’ll dispose of the old materials responsibly. Many renovation projects generate significant waste that requires specialized handling. Our guide on sustainable junk removal and recycling statistics provides valuable insights on how to minimize the environmental impact of your renovation waste.
Embodied Carbon Financial Implications
As carbon taxation expands, the embodied carbon in building materials represents future financial liability. This liability is becoming increasingly relevant as carbon regulations and pricing mechanisms expand globally.
Typical office renovations generate 30-50 kg of embodied carbon per square foot, representing $1.50-$7.50 in future carbon liability. This liability should be factored into material selection decisions, particularly for organizations with long-term ownership horizons.
Low-carbon alternatives typically cost 3-8% more initially but reduce embodied carbon by 30-70%. This reduction in carbon liability often justifies the higher initial investment, particularly for organizations with environmental commitments.
ESG rating improvements from carbon-conscious renovations can reduce corporate borrowing costs by 0.15-0.25%, delivering significant financial benefits for large organizations. This reduction in capital costs can represent millions of dollars in savings for large corporations.
I recommend calculating potential carbon costs by multiplying materials’ embodied carbon (kgCO2e) by projected carbon prices ($50-150/ton by 2030). Companies documenting carbon-conscious renovations report 15-20% improvements in ESG ratings, potentially lowering capital costs by 0.15-0.25%.
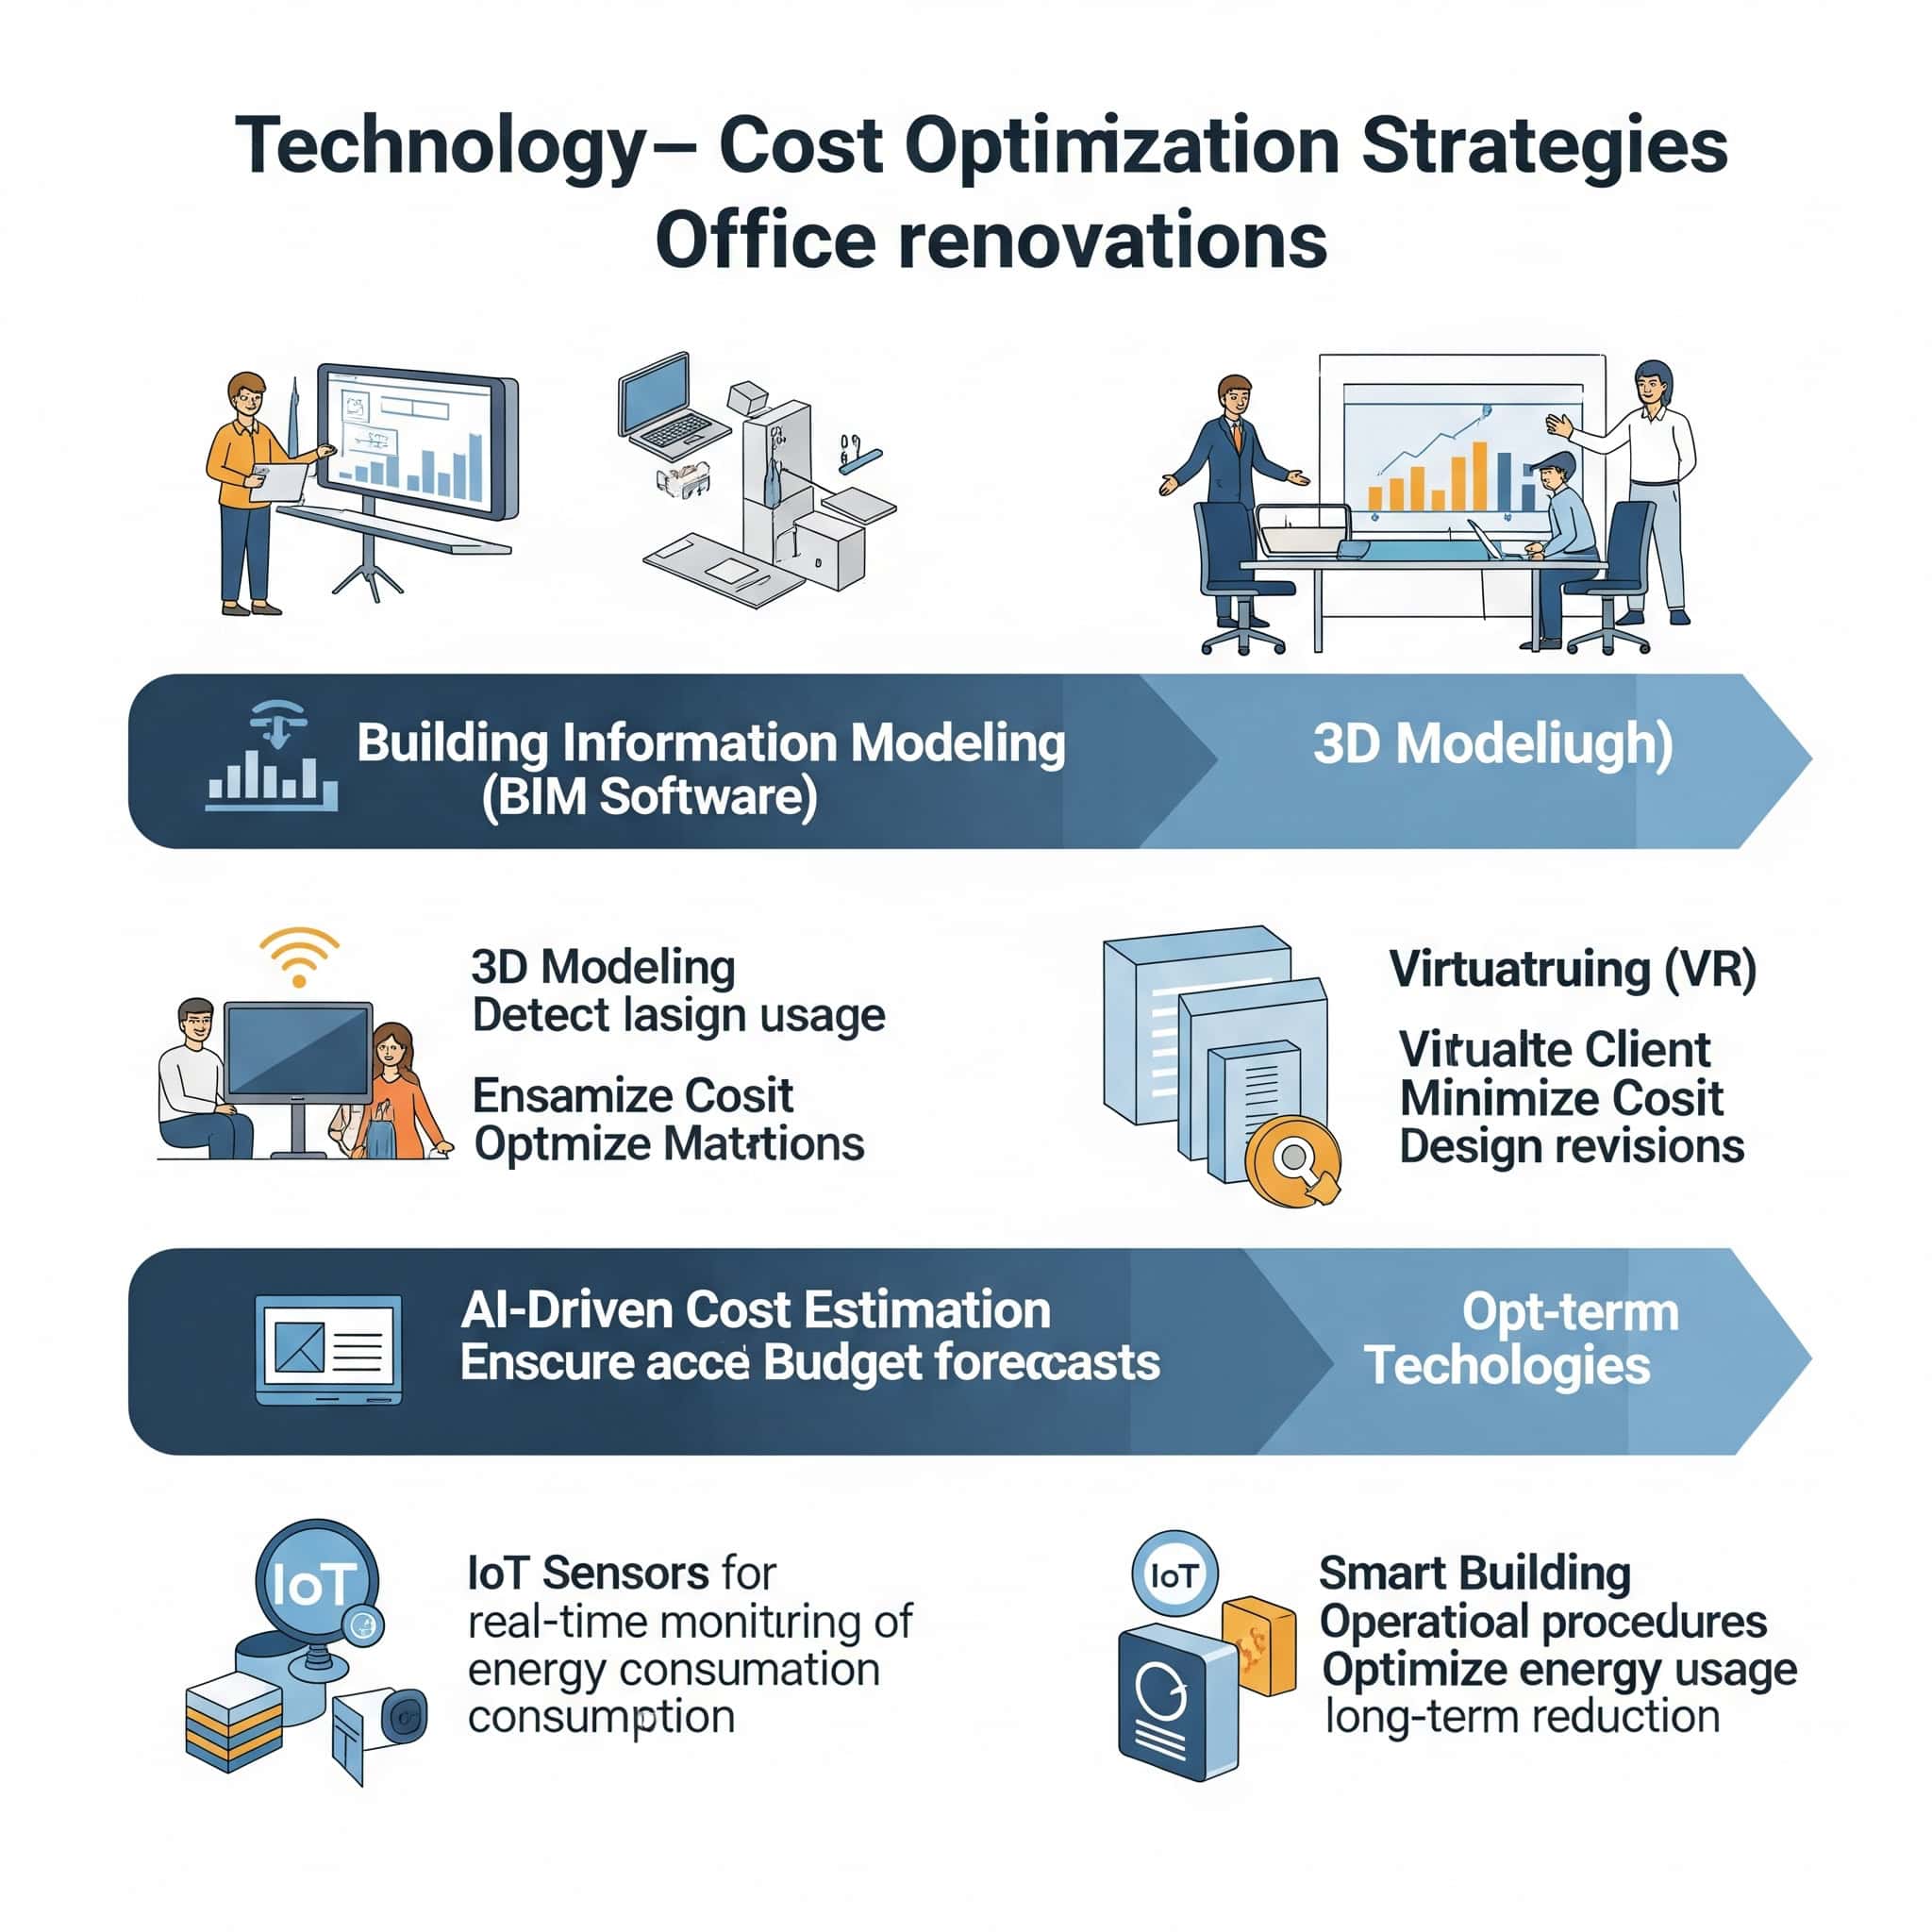
Technology-Enabled Cost Optimization Strategies
Emerging technologies are transforming how renovation costs are estimated, managed, and optimized. I’ve seen these digital approaches deliver remarkable results for forward-thinking organizations.
Technology-enabled approaches reduce renovation costs by 10-20% through improved planning, execution, and management. This significant cost reduction makes technology adoption one of the highest-ROI investments in renovation planning.
Digital tools enable scenario testing that identifies optimal solutions before physical work begins. This testing capability helps avoid costly mistakes and rework during construction.
Digital Twin Cost Modeling
Creating digital replicas of existing and proposed spaces enables sophisticated cost scenario planning that traditional approaches cannot match. I’ve found this approach particularly valuable for complex renovation projects.
Digital twin modeling reduces estimation errors by 40-60% compared to traditional methods. This improved accuracy helps prevent both budget overruns and underinvestment in critical areas.
Virtual testing enables evaluation of 5-10x more design options than physical mockups. This expanded testing capability helps identify optimal solutions that might be missed with more limited testing approaches.
Digital models improve stakeholder alignment by 30-50% through improved visualization and understanding. This improved alignment helps prevent costly changes during construction due to stakeholder misunderstandings.
These virtual models allow testing multiple options and configurations before committing to physical changes, optimizing both costs and outcomes. The ability to test virtually before building physically represents one of the most significant advances in renovation planning in recent decades.
Parametric Cost Estimation
Implement parametric modeling tools that dynamically adjust cost projections based on design variables. This dynamic adjustment capability provides unprecedented visibility into the cost implications of design decisions.
Parametric models incorporate 50-100x more variables than traditional estimating methods. This increased variable incorporation dramatically improves estimation accuracy, particularly for complex projects.
Real-time cost feedback reduces design rework by 30-50% by identifying budget issues immediately. This reduction in rework represents significant time and cost savings during the design process.
Parametric estimation improves budget accuracy by 15-25% compared to traditional square footage calculations. This improved accuracy helps prevent both budget overruns and underinvestment in critical areas.
This approach enables real-time cost feedback during design development, allowing stakeholders to see financial implications of decisions immediately. Organizations using parametric estimation report 8-12% lower variance between estimates and final costs compared to traditional methods.
Virtual Scenario Testing
Test multiple renovation approaches virtually before physical work begins. This virtual testing capability helps identify optimal solutions while avoiding the cost and time requirements of physical mockups.
Virtual testing costs 5-10% of physical mockups while evaluating more variables. This favorable cost-benefit ratio makes virtual testing an extremely high-ROI investment in renovation planning.
Scenario testing typically identifies 15-25% cost savings opportunities not visible in traditional planning. These savings opportunities often more than pay for the cost of virtual testing.
Virtual user testing improves space functionality by 20-30% by identifying issues before construction. This improved functionality represents significant value that extends throughout the life of the renovated space.
Digital twins allow simulation of phasing strategies, material options, and configuration alternatives at minimal cost. Companies leveraging virtual testing evaluate 3-5 times more options than traditional approaches, identifying optimal solutions that typically reduce overall project costs by 7-14%.
Real-Time Project Economics
Connected technologies transform renovation financial management from periodic reporting to continuous optimization. I’ve seen this transformation deliver remarkable results for forward-thinking organizations.
Real-time monitoring reduces budget overruns by 30-50% compared to traditional reporting methods. This reduction in overruns represents significant value that drops directly to the bottom line.
Connected systems identify optimization opportunities throughout project execution. These opportunities often represent significant value that would be missed with traditional management approaches.
Data-driven approaches improve resource utilization by 15-25% across labor, materials, and equipment. This improved utilization represents significant cost savings throughout the project lifecycle.
These approaches provide unprecedented visibility into project performance, enabling immediate intervention when deviations occur and optimizing resource utilization throughout the project. The ability to intervene immediately rather than waiting for periodic reports represents a fundamental shift in project management capability.
IoT-Enhanced Project Tracking
Deploy IoT sensors to monitor construction progress, material usage, and labor efficiency in real-time. This monitoring capability provides unprecedented visibility into project performance.
IoT sensors cost $0.50-$2.00 per square foot but generate $3-5 in savings through improved project management. This favorable ROI makes IoT deployment a wise investment for most renovation projects.
Real-time tracking reduces material waste by 15-25% through improved inventory management. This waste reduction represents significant cost savings that drop directly to the bottom line.
Labor productivity improves by 10-20% when workers know their activities are being monitored and optimized. This productivity improvement represents one of the largest value streams from IoT deployment.
This visibility enables immediate intervention when projects deviate from financial targets. Early adopters report 9-15% savings through waste reduction, improved labor utilization, and just-in-time material delivery coordination.
During your office renovation, you’ll likely need to dispose of various materials and items that are no longer needed. Rather than adding to landfill waste, consider eco-friendly disposal options. Our article on eco-friendly trash removal services explains how professional waste management can help your renovation project maintain environmental responsibility throughout the process.
Blockchain-Based Contract Management
Implement smart contracts that automatically validate work completion and trigger payments based on verified milestones. This automation eliminates much of the administrative overhead associated with traditional contract management.
Smart contracts reduce payment processing costs by 50-70% compared to traditional methods. This cost reduction represents significant savings, particularly for projects with numerous payment milestones.
Automated verification improves quality control by ensuring all contract requirements are met before payment. This improved quality control helps prevent costly rework and warranty issues.
Accelerated payment cycles reduce project financing costs by 1-3% while improving subcontractor performance and pricing. This improvement in financing costs and subcontractor relations represents significant value that drops directly to the bottom line.
This approach reduces administrative overhead by 40-60% while accelerating payment cycles by 15-20 days on average, potentially qualifying for early payment discounts from vendors (typically 2-3% of material costs).
Post-Pandemic Office Renovation Economics
The COVID-19 pandemic fundamentally altered office utilization patterns, creating new economic considerations for renovation planning. I’ve found that these changes require entirely new approaches to office design and investment.
Post-pandemic office utilization averages 30-50% of pre-pandemic levels, requiring new economic models. This dramatic reduction in utilization has profound implications for renovation planning and investment.
Hybrid work patterns have changed the value equation for different space types and configurations. Spaces that support hybrid work now deliver significantly more value than those designed for traditional work patterns.
Hybrid-Optimized Space Economics
Designing for hybrid work patterns requires different economic calculations than traditional office planning. I’ve found that these new calculations often lead to significantly different investment priorities.
Hybrid-optimized spaces cost 10-20% more per square foot but require 30-50% less total area. This reduction in total area more than offsets the higher per-square-foot cost, resulting in lower overall investment.
Technology integration represents 25-35% of hybrid space costs versus 10-15% in traditional offices. This increased technology investment is essential for supporting effective hybrid collaboration.
Effective hybrid spaces balance physical and digital elements to support consistent experiences regardless of location. This balance is critical for maintaining team cohesion and effectiveness in hybrid work environments.
These spaces must accommodate variable occupancy, support both in-person and remote collaboration, and deliver value despite lower utilization rates. The ability to deliver value with lower utilization rates represents one of the most significant challenges in post-pandemic office design.
Occupancy Flux Accommodation Value
Design for peak occupancy variations of 30-70% rather than static capacity. This design approach reflects the reality of hybrid work patterns, where office attendance varies significantly from day to day.
Flexible environments cost 15-25% more per square foot but accommodate 40-60% more people through sharing ratios. This increased accommodation capacity more than offsets the higher per-square-foot cost.
Occupancy sensors reveal that most organizations need capacity for only 60-70% of employees simultaneously. This insight often leads to significant reductions in total space requirements.
Adaptable furniture systems cost 30-50% more initially but reduce reconfiguration costs by 70-80%. This reduction in reconfiguration costs represents significant long-term value, particularly for organizations with evolving space needs.
I recommend calculating the economic value of flexibility by comparing the cost of fixed workstations versus adaptable environments against your specific occupancy patterns. Organizations with highly variable attendance save $2,500-4,000 per employee annually through right-sized flexible environments compared to traditional fixed-capacity designs.
Technology-Physical Space Balance Sheet
Develop a comprehensive balance sheet that weighs physical renovation investments against digital workspace technology. This balanced approach ensures optimal allocation of resources between physical and digital environments.
Digital collaboration tools cost $500-1,200 per employee annually but can reduce physical space needs by 30-50%. This reduction in physical space often more than offsets the cost of digital tools.
Integrated physical-digital environments improve collaboration effectiveness by 25-35% compared to either alone. This improved effectiveness represents significant value that extends throughout the organization.
Technology investments depreciate over 3-5 years versus 10-15 years for physical improvements, requiring different financial models. These different depreciation schedules should be factored into investment decisions to ensure accurate financial analysis.
For every $1,000 reduction in physical space per employee, I recommend allocating $350-500 to enhanced digital collaboration tools. Companies achieving this balance report 22-28% higher team effectiveness scores compared to those heavily weighted toward either physical or digital environments.
Health-Centered Renovation Economics
Post-pandemic awareness of workplace health has created new economic considerations for office renovations. I’ve found that these health investments often deliver remarkable returns through improved performance and reduced absenteeism.
Health-focused renovations add 5-10% to project costs but deliver 15-25% returns through improved performance. This favorable return makes health investments some of the highest-ROI components of modern office renovations.
Wellness features have moved from amenities to essential elements in post-pandemic workplace planning. This shift reflects increased awareness of the connection between workplace health and business performance.
Health investments create measurable returns through reduced absenteeism, improved cognitive function, and enhanced recruitment/retention. These returns often justify health investments even without considering their primary purpose of protecting employee health.
Biophilic Design Value Metrics
Biophilic elements (natural materials, plantings, daylight) add 5-8% to renovation costs but reduce absenteeism by 10-15% and increase cognitive function by 8-12%. These performance improvements represent significant value that often justifies the higher initial investment.
Biophilic elements cost $5-10 per square foot but generate $15-25 per square foot in annual productivity benefits. This favorable annual return makes biophilic design one of the highest-ROI components of modern office renovations.
Natural light exposure improves cognitive performance by 10-25% on tasks requiring concentration. This cognitive improvement represents significant value for knowledge-intensive organizations.
Living plants improve air quality while reducing stress hormones by 15-20%, enhancing both wellness and performance. This dual benefit makes plants one of the most cost-effective biophilic elements.
I recommend calculating the return by multiplying your average daily employee cost by projected attendance improvements and cognitive productivity gains. Forward-thinking companies now allocate 3-5% of renovation budgets specifically to biophilic elements based on these economic returns.
Air Quality Investment Framework
Develop tiered air quality investments based on space function and occupancy density. This tiered approach ensures optimal allocation of air quality investments based on specific space requirements.
Enhanced ventilation systems increase energy costs by 10-15% but reduce sick days by 15-25%. This reduction in sick days often more than offsets the higher energy costs.
MERV-13+ filtration costs $0.50-$1.00 more per square foot annually but removes 85-90% of airborne pathogens. This pathogen removal represents significant value through reduced illness transmission.
CO2 monitoring and demand-controlled ventilation optimize both air quality and energy usage, delivering 20-30% energy savings compared to constant-volume systems. This dual optimization makes these systems particularly valuable for organizations with both health and sustainability priorities.
High-density collaboration areas warrant MERV-13+ filtration and dedicated ventilation at $4-7 per square foot premium, while transitional spaces may require less intensive solutions. Organizations implementing strategic air quality investments report 12-18% reductions in respiratory-related sick days and 5-9% improvements in cognitive performance metrics.
Construction Waste Management: The Jiffy Junk Solution
Construction waste management represents a significant but often overlooked component of renovation costs. I’ve found that proper waste management can significantly impact both project costs and environmental footprint.
Construction waste typically generates 3-5 pounds of material per square foot of renovation. This significant waste volume requires careful management to minimize both cost and environmental impact.
Professional waste management services reduce disposal costs by 15-25% compared to contractor-managed disposal. This cost reduction represents significant value that drops directly to the bottom line.
Recycling and donation programs can divert 60-80% of renovation waste from landfills while potentially qualifying for tax benefits. These benefits make professional waste management both economically and environmentally advantageous.
Traditional disposal methods add 3-5% to project costs through dumpster rental, hauling fees, and landfill charges. Jiffy Junk’s specialized commercial services handle the complete removal process efficiently while supporting sustainability goals through recycling and donation programs.
Managing construction waste efficiently is crucial for keeping your renovation on schedule and budget. As explained in our guide on demolition waste removal options, professional junk removal services can help you navigate the complexities of construction debris disposal, ensuring your project remains compliant with local regulations while minimizing environmental impact.
Final Thoughts: Maximizing Your Office Renovation Investment
Office renovations represent significant investments that impact every aspect of your organization. I’ve found that the most successful renovations balance immediate needs with long-term flexibility to accommodate future changes.
Comprehensive renovation planning that addresses all factors discussed in this guide typically reduces total costs by 15-25%. This significant cost reduction makes thorough planning one of the highest-ROI investments in renovation projects.
The most successful renovations balance immediate needs with long-term flexibility to accommodate future changes. This balance ensures your renovation delivers value throughout its lifecycle, even as your organization evolves.
Measuring success requires tracking both financial metrics and human factors like productivity, satisfaction, and wellness. This comprehensive measurement approach provides a much more accurate picture of renovation value than financial metrics alone.
By understanding the psychological factors, technical considerations, advanced cost metrics, financial structures, material selection economics, technology optimization strategies, and post-pandemic realities discussed in this guide, you can create spaces that deliver meaningful returns while supporting your organizational goals. Remember that the true cost of renovation extends far beyond the initial price tag—it includes impacts on productivity, collaboration, wellness, and retention that determine the real value of your investment.
When planning your next office renovation, consider partnering with Jiffy Junk for professional construction waste removal. Our team specializes in responsible disposal of renovation debris, ensuring your project maintains environmental responsibility from demolition through completion. We’ll handle everything from old fixtures to construction materials, leaving your newly renovated spaces clean and ready for immediate use. Contact us today to learn how our services can streamline your renovation process while supporting your sustainability goals.